Fig. 8.
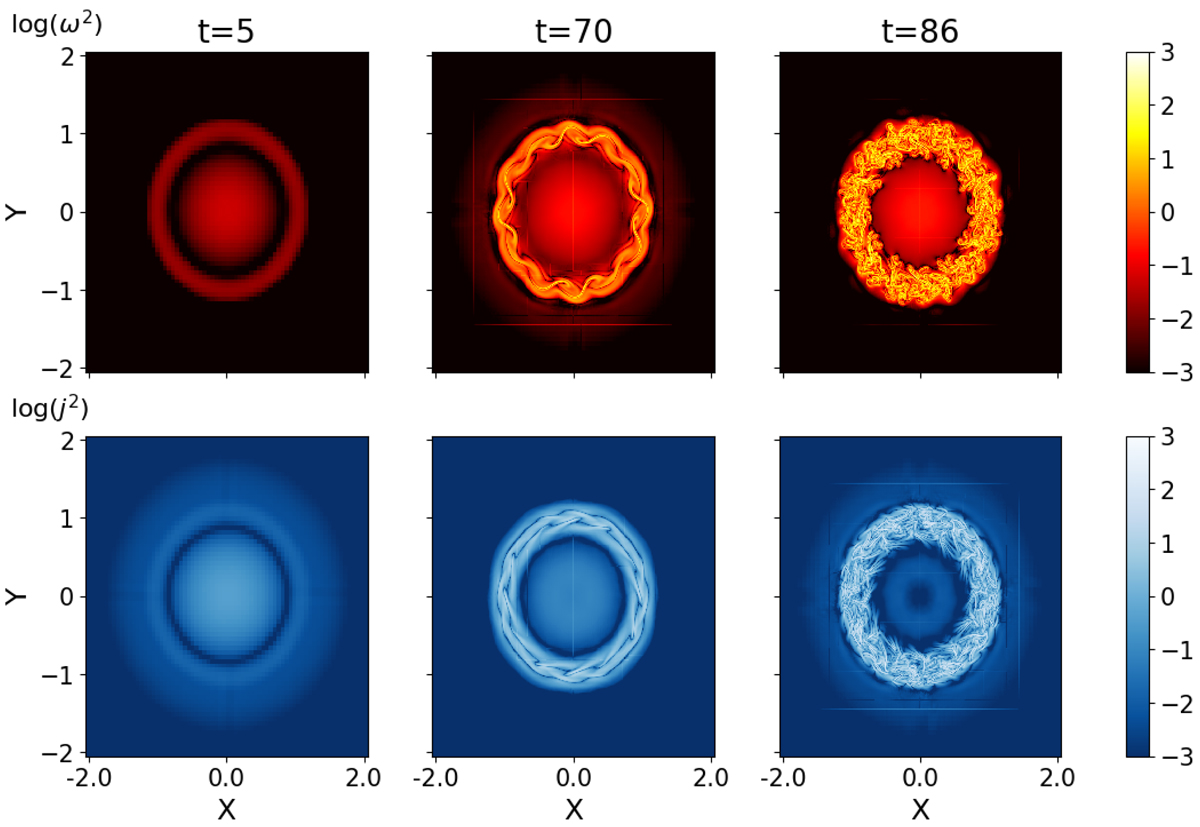
Top: cross-sectional cut at z = 0 of vorticity squared (in logarithmic scale) for the thin-layer case at three different simulation times indicated above each panel. Bottom: same, but for the current density squared at z ≈ L/2. The straight lines seen in some panels are visualization artifacts at the boundaries of different AMR patches. These artifacts are not present in the actual simulation data. The full temporal evolution is available as an online movie.
Current usage metrics show cumulative count of Article Views (full-text article views including HTML views, PDF and ePub downloads, according to the available data) and Abstracts Views on Vision4Press platform.
Data correspond to usage on the plateform after 2015. The current usage metrics is available 48-96 hours after online publication and is updated daily on week days.
Initial download of the metrics may take a while.