Fig. 17.
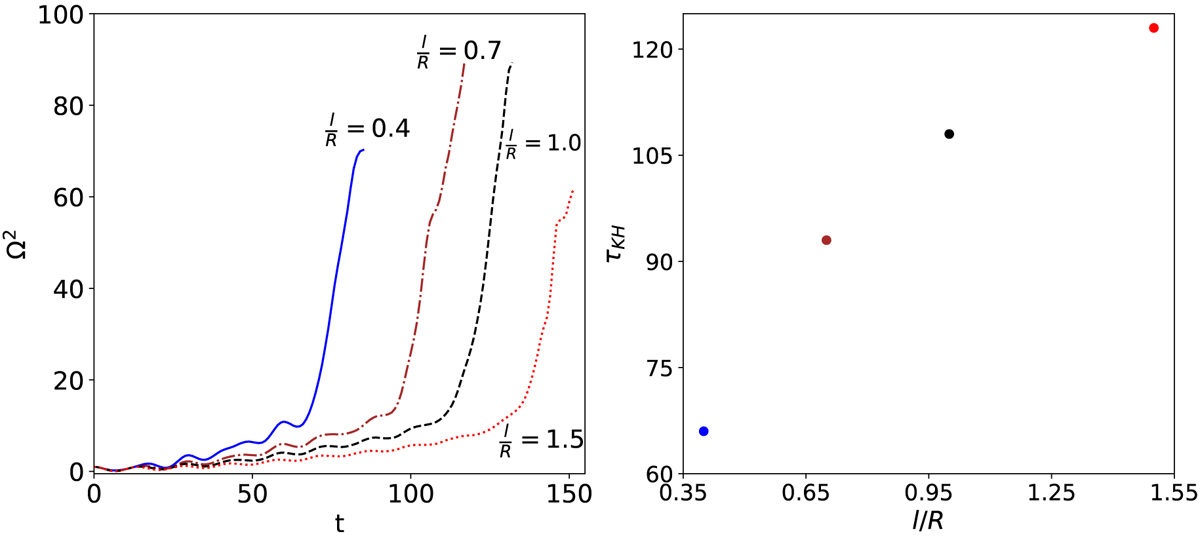
Left panel: vorticity squared integrated over the whole computational domain as a function of the simulation time for ε = 0.1, ρi/ρe = 2.0, L/R = 10, and l/R = {0.4,0.7,1.0,1.5}. The curves are normalized to the integrated vorticity squared at t = 0. Right panel: estimated τKH as a function of the width of the transition region, l/R.
Current usage metrics show cumulative count of Article Views (full-text article views including HTML views, PDF and ePub downloads, according to the available data) and Abstracts Views on Vision4Press platform.
Data correspond to usage on the plateform after 2015. The current usage metrics is available 48-96 hours after online publication and is updated daily on week days.
Initial download of the metrics may take a while.