Fig. 16.
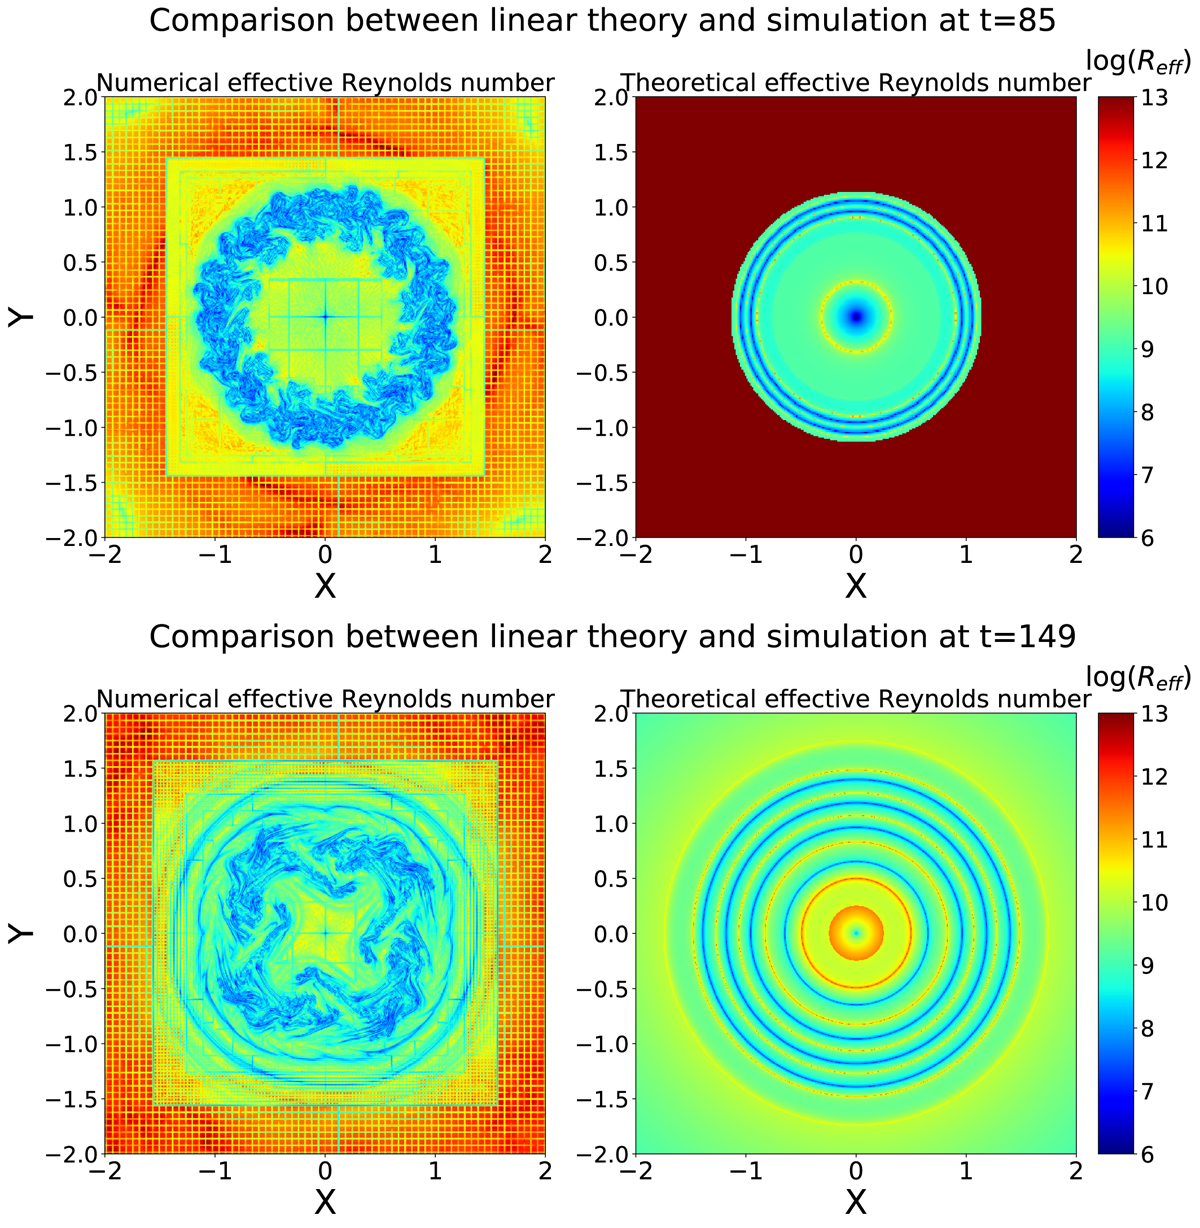
Top: numerical (left) and analytic (right) effective Reynolds number in logarithmic scale at the end time of the simulation in the thin-layer case. These results are calculated in a cross-sectional cut at z = 0. The straight lines seen in the numerical result are visualization artifacts due to the AMR scheme. These artifacts are not present in the actual simulation data. Bottom: same as top panels, but for the thick-layer case.
Current usage metrics show cumulative count of Article Views (full-text article views including HTML views, PDF and ePub downloads, according to the available data) and Abstracts Views on Vision4Press platform.
Data correspond to usage on the plateform after 2015. The current usage metrics is available 48-96 hours after online publication and is updated daily on week days.
Initial download of the metrics may take a while.