Fig. 13.
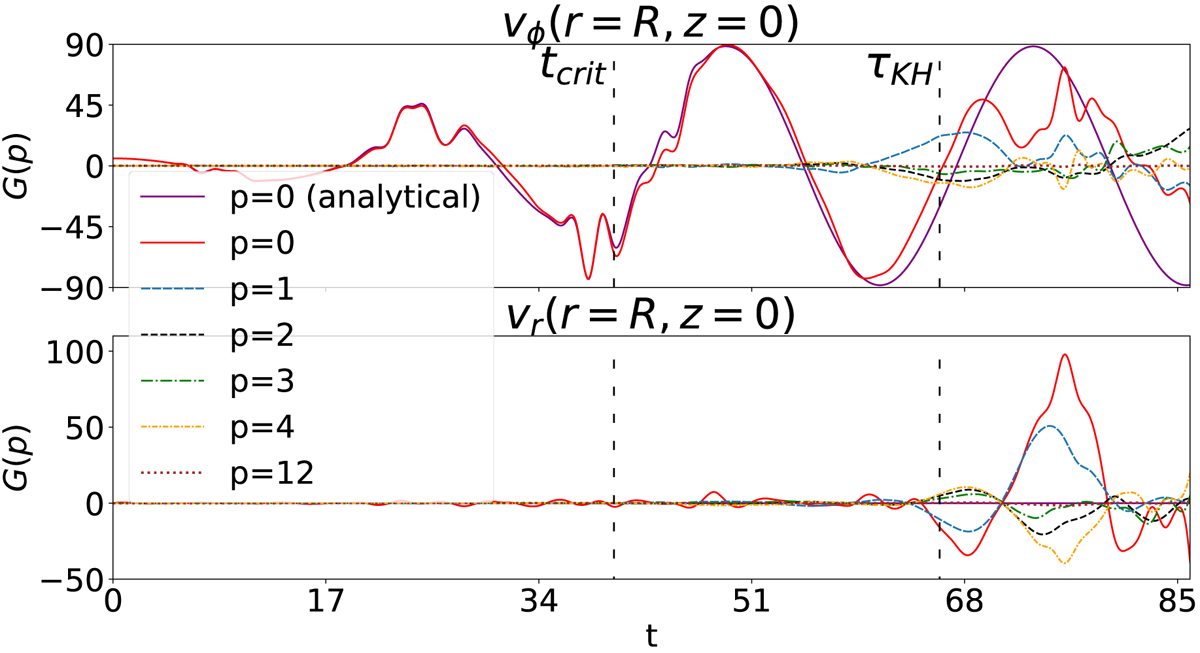
Top panel: real part of the Fourier coefficients with p = 0, 1, 2, 3, 4, and 12 as functions of the computational time for an angular sampling of the azimuthal component of velocity at r = R and z = 0 in the thin-layer case. The two vertical dashed lines correspond to the critical time of Browning & Priest (1984), tcrit = 40, and the onset time inferred from the integrated vorticity slope change, τKH = 66. The linear analytic result, where only the p = 0 mode is present, is overplotted for comparison. Bottom panel: same as top panel but for the radial component of velocity.
Current usage metrics show cumulative count of Article Views (full-text article views including HTML views, PDF and ePub downloads, according to the available data) and Abstracts Views on Vision4Press platform.
Data correspond to usage on the plateform after 2015. The current usage metrics is available 48-96 hours after online publication and is updated daily on week days.
Initial download of the metrics may take a while.