Fig. 12.
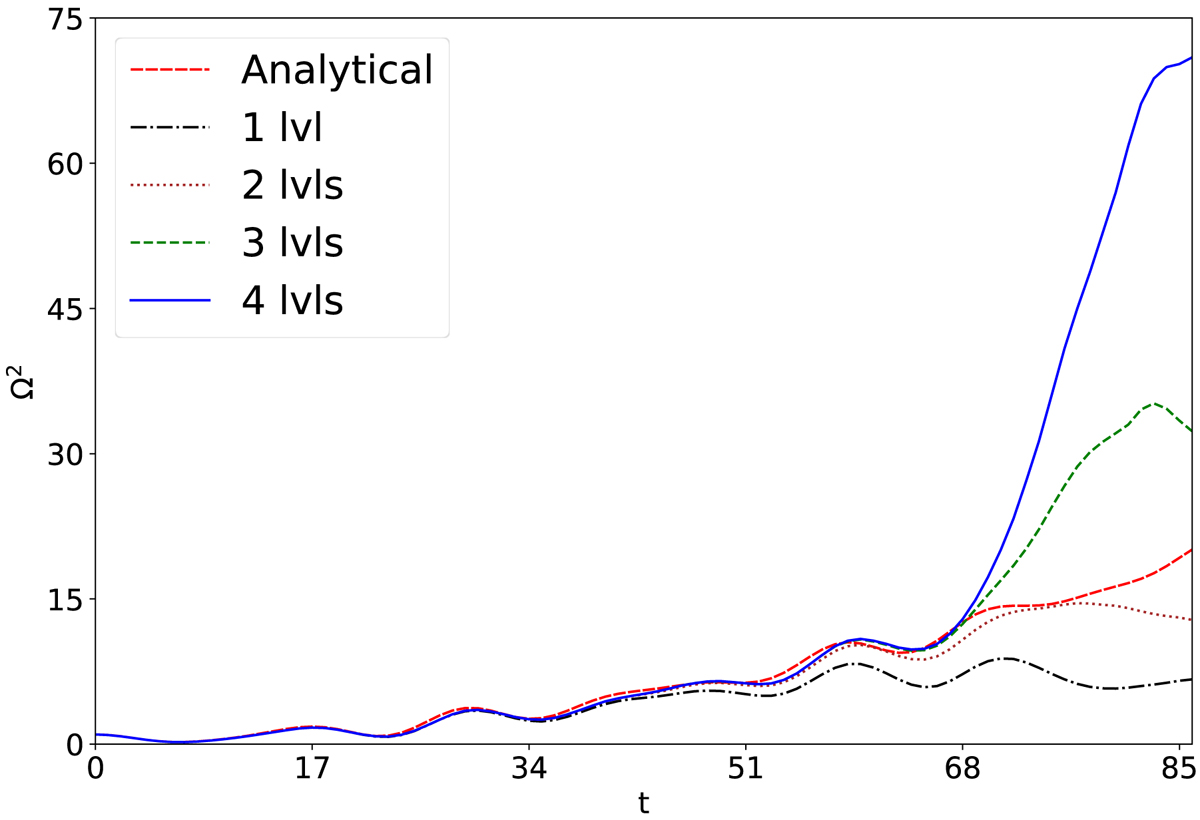
Vorticity squared integrated over the whole computational domain as a function of simulation time for the thin-layer case. The various lines correspond to simulations with different levels of refinement in the AMR scheme: 1 (black dot-dashed line), 2 (brown dotted line), 3 (green dashed line), and 4 (blue solid line). For comparison purposes, the linear analytical value is also shown (red dashed line). Vorticity is normalized to the value at t = 0.
Current usage metrics show cumulative count of Article Views (full-text article views including HTML views, PDF and ePub downloads, according to the available data) and Abstracts Views on Vision4Press platform.
Data correspond to usage on the plateform after 2015. The current usage metrics is available 48-96 hours after online publication and is updated daily on week days.
Initial download of the metrics may take a while.