Fig. 11.
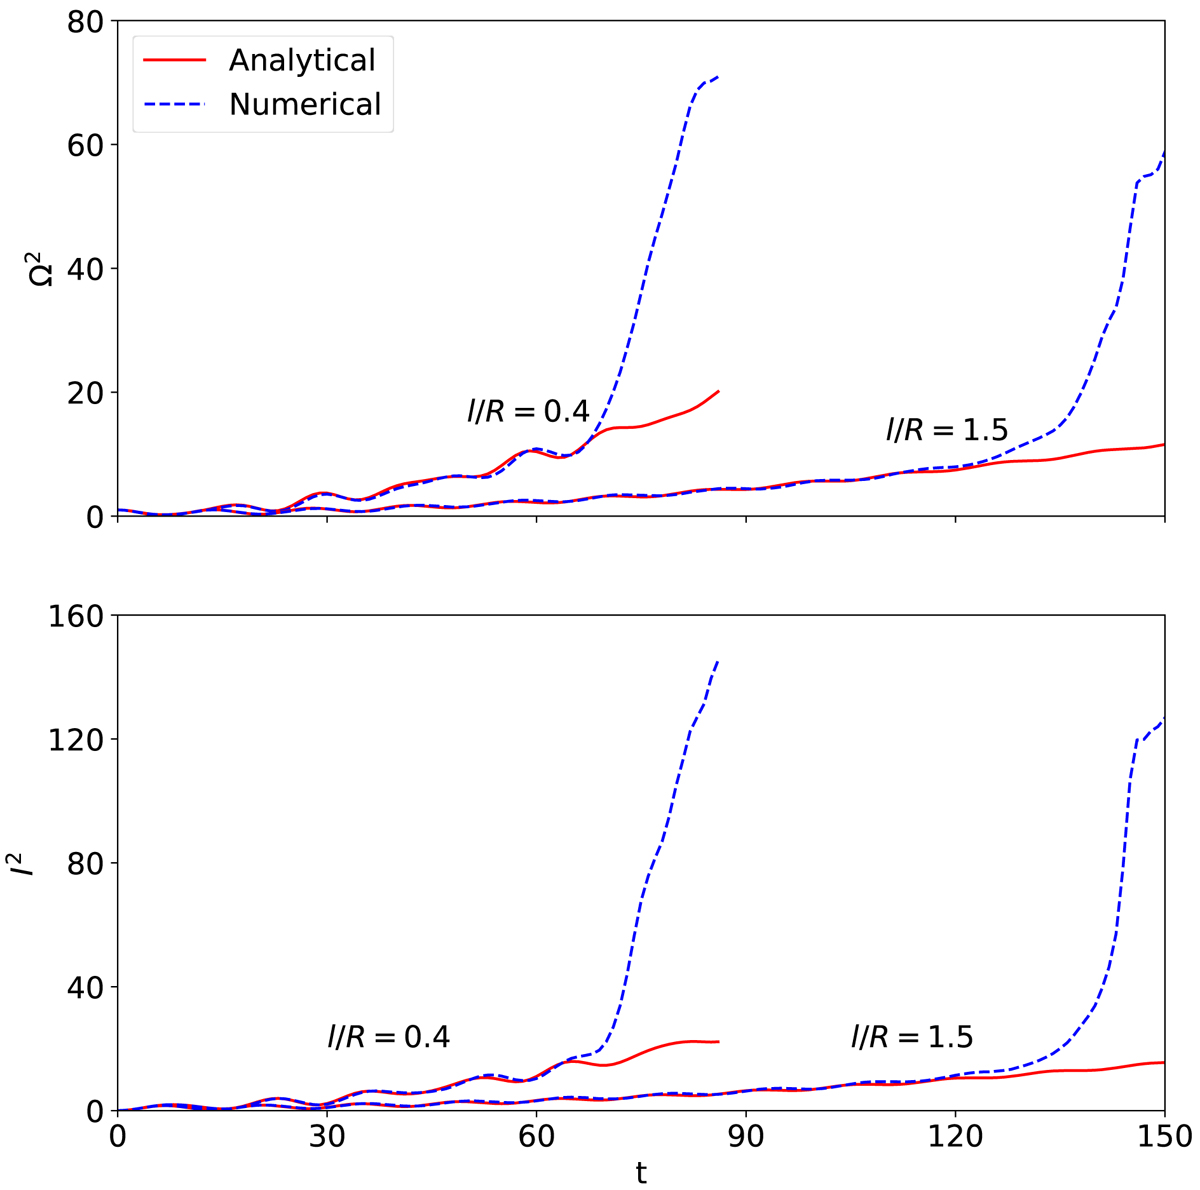
Vorticity squared (top panel) and current density squared (bottom panel) integrated over the whole computational domain as a function of simulation time for both thin-layer (l/R = 0.4) and thick-layer (l/R = 1.5) cases. Red solid lines correspond to linear analytic results, and blue dashed lines correspond to nonlinear numerical results. Vorticity is normalized to the value at t = 0. No normalization is needed for current density since it vanishes at t = 0.
Current usage metrics show cumulative count of Article Views (full-text article views including HTML views, PDF and ePub downloads, according to the available data) and Abstracts Views on Vision4Press platform.
Data correspond to usage on the plateform after 2015. The current usage metrics is available 48-96 hours after online publication and is updated daily on week days.
Initial download of the metrics may take a while.