Fig. 10.
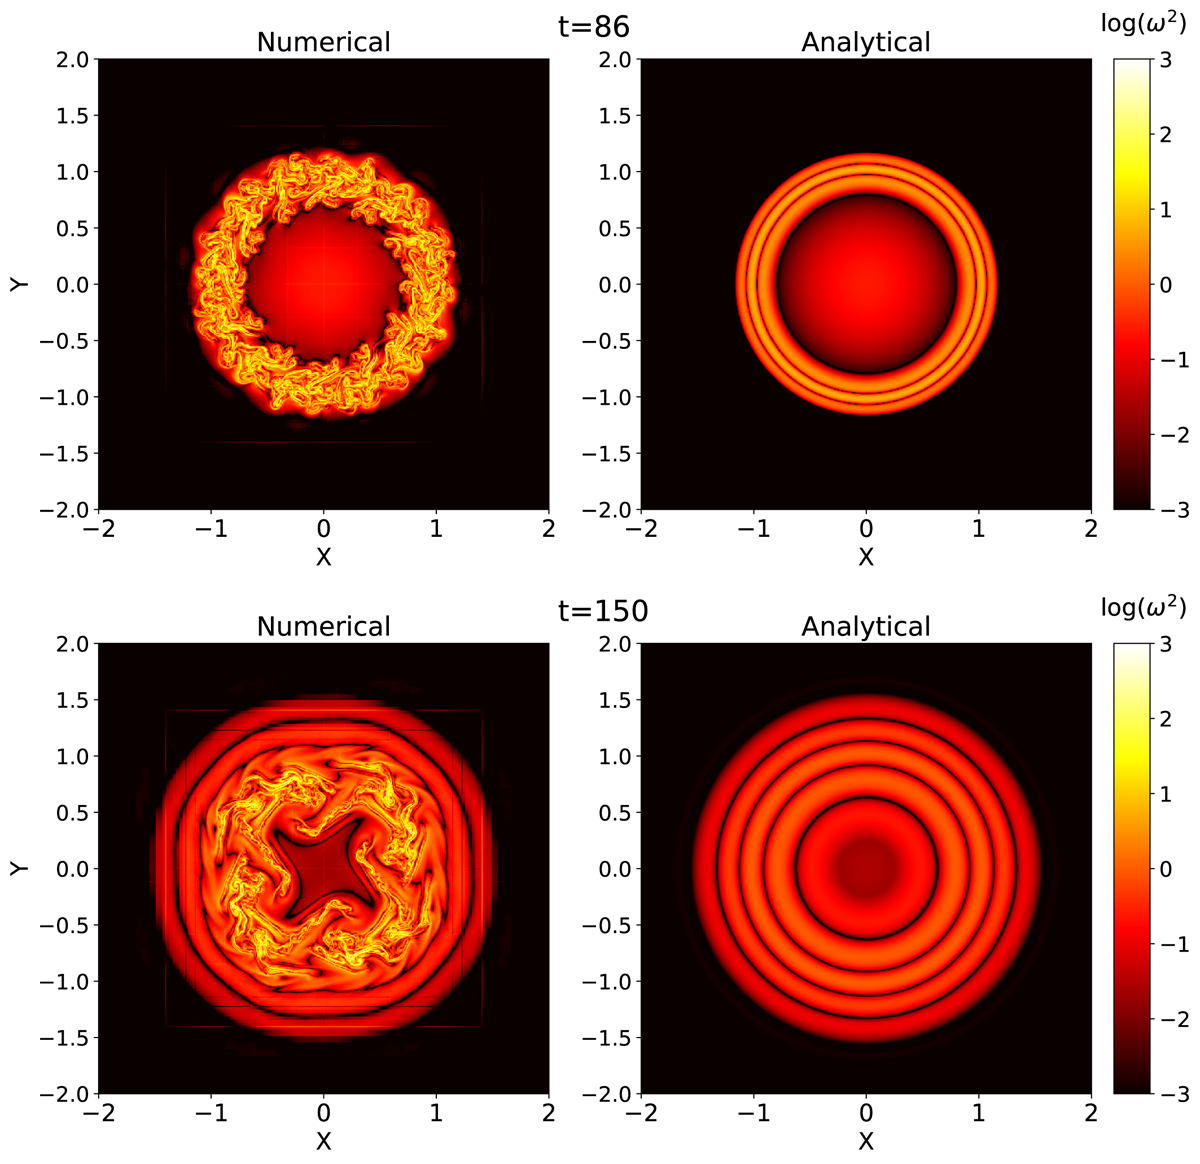
Top: cross-sectional cut at z = 0 of vorticity squared (in logarithmic scale) for the thin-layer case at the final simulation time. The left and right panels correspond to the nonlinear numerical results and the linear analytic results, respectively. Bottom: same, but for the thick-layer case.
Current usage metrics show cumulative count of Article Views (full-text article views including HTML views, PDF and ePub downloads, according to the available data) and Abstracts Views on Vision4Press platform.
Data correspond to usage on the plateform after 2015. The current usage metrics is available 48-96 hours after online publication and is updated daily on week days.
Initial download of the metrics may take a while.