Free Access
Fig. 8.
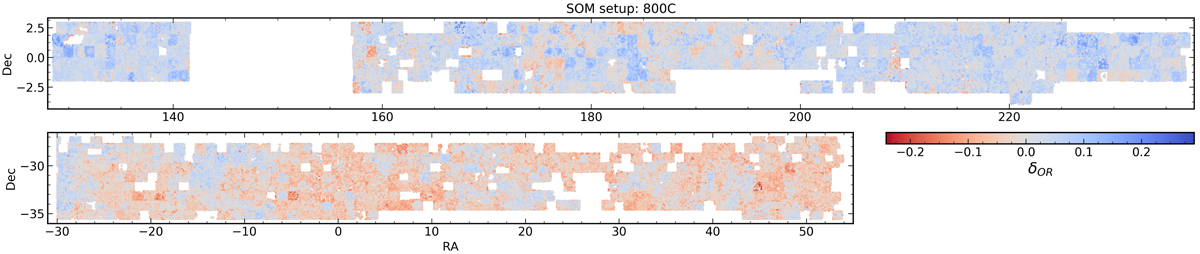
Systematic density contrast δOR (Eq. (5.3)) inferred for the KiDS-North (top panel) and KiDS-South (bottom panel) areas of the KiDS-1000 bright sample (KiDS-Bright) by the 800C SOM setup. We use these maps to construct our organised randoms, populating the footprint to mirror the systematic density modes.
Current usage metrics show cumulative count of Article Views (full-text article views including HTML views, PDF and ePub downloads, according to the available data) and Abstracts Views on Vision4Press platform.
Data correspond to usage on the plateform after 2015. The current usage metrics is available 48-96 hours after online publication and is updated daily on week days.
Initial download of the metrics may take a while.