Fig. B.4.
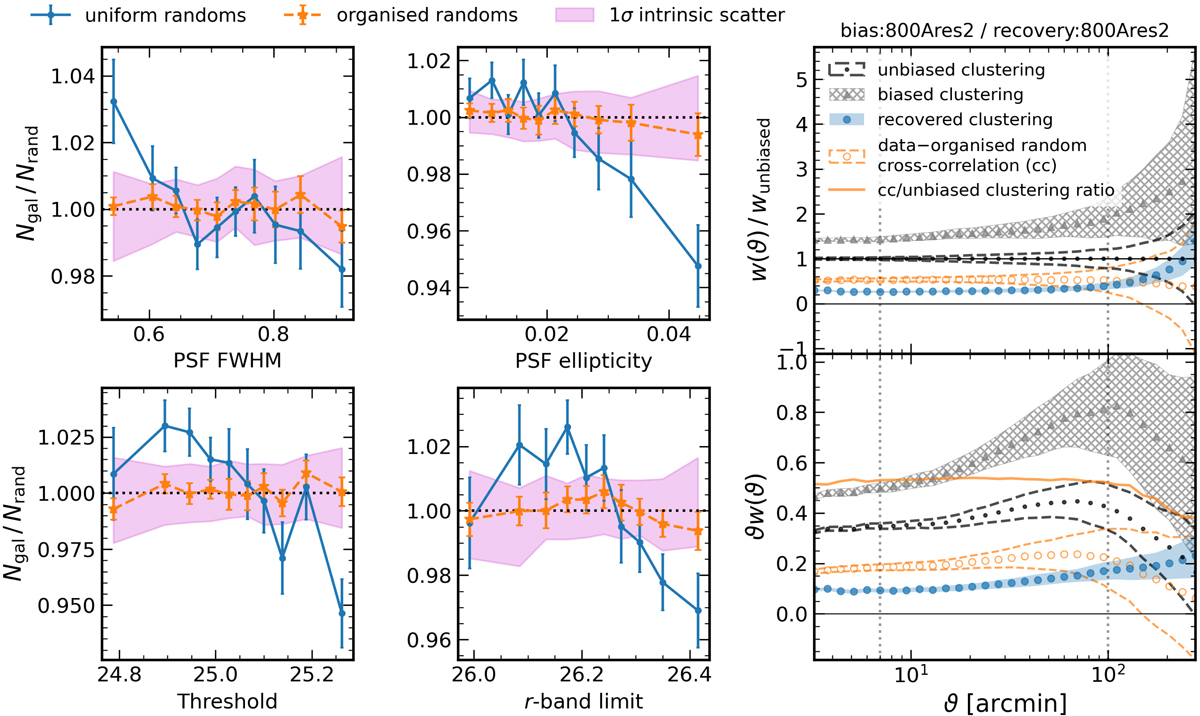
Same as Fig. B.3, now for bias:800Ares2/recovery:800Ares2, i.e. the high-resolution setup, and considering systematic-tracers rather than PCA components. Nearly perfect one-point correlation corrections (left) are accompanied by the cross-correlation between unbiased FLASK data and organised randoms (right; orange) rising to ∼50% of the unbiased clustering signature, compared with the negligible cross-correlation in Fig. B.3.
Current usage metrics show cumulative count of Article Views (full-text article views including HTML views, PDF and ePub downloads, according to the available data) and Abstracts Views on Vision4Press platform.
Data correspond to usage on the plateform after 2015. The current usage metrics is available 48-96 hours after online publication and is updated daily on week days.
Initial download of the metrics may take a while.