Free Access
Fig. A.1.
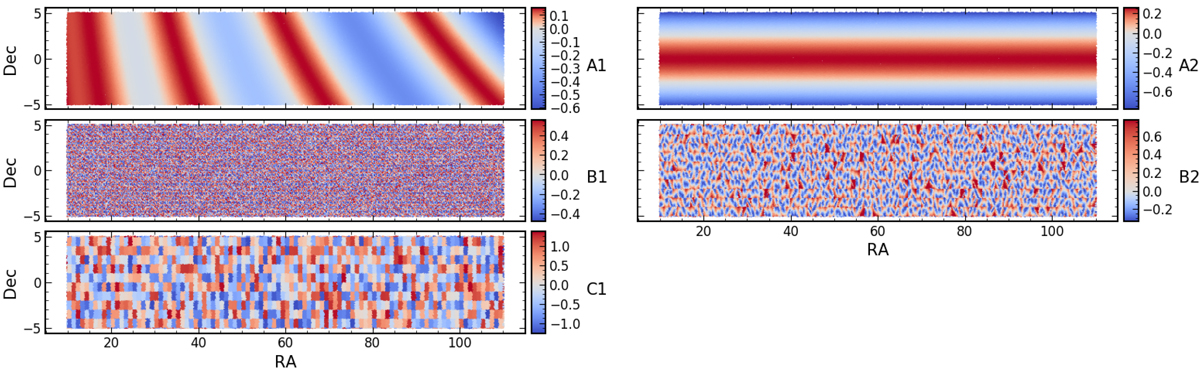
Same as Fig. 5, but only for parameters with non-zero depletion functions. The colouring now denotes the excess probability of depletion as a function of each artificial systematic. A galaxy with an excess probability of 1 is 100% more (or twice as) likely to be depleted when compared with an excess probability of zero.
Current usage metrics show cumulative count of Article Views (full-text article views including HTML views, PDF and ePub downloads, according to the available data) and Abstracts Views on Vision4Press platform.
Data correspond to usage on the plateform after 2015. The current usage metrics is available 48-96 hours after online publication and is updated daily on week days.
Initial download of the metrics may take a while.