Fig. 12.
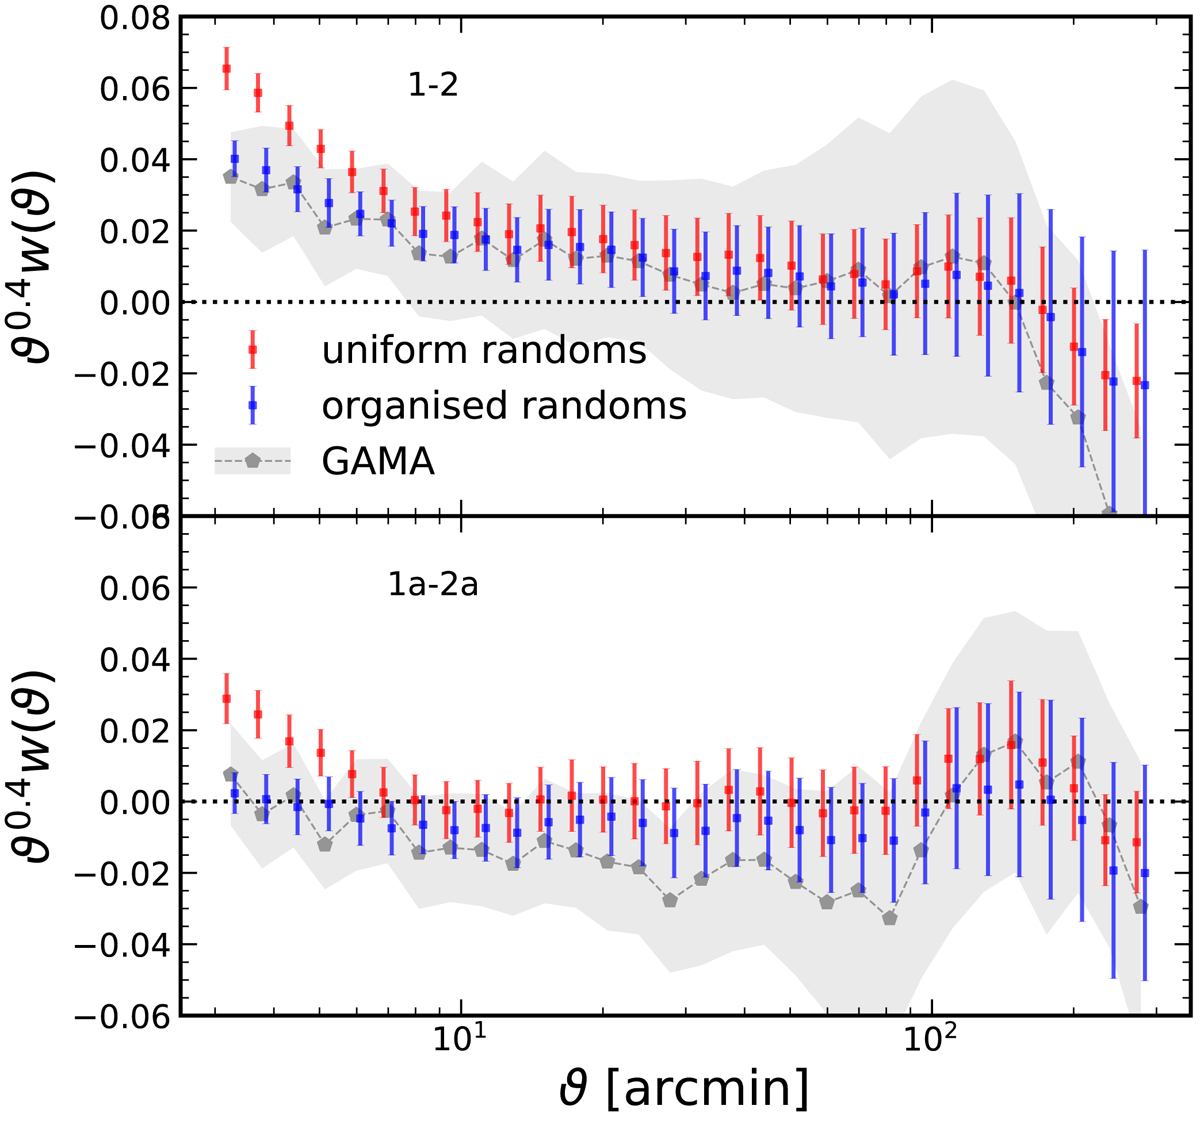
Angular cross-correlation functions w(ϑ) measured between KiDS-1000 bright sample (KiDS-Bright) redshift bins 1 and 2 (top), with edges ∈[0.02, 0.2, and 0.5], and 1a and 2a (bottom), with edges ∈[ 0.02 and 0.22 ] and [ 0.28 and 0.5 ], as shown in Fig. 3. Measurements using uniform randoms are shown in red, and those made with 100A organised randoms are shown in blue. Errors are estimated with a 2D delete-one jackknife with 31 pseudo-independent patches of the footprint. Grey points and shading give the equivalently binned (by ANNZ2 photo-z) correlations measured for the GAMA sample, with errors estimated again with a jackknife, but from 20 sub-regions of the GAMA window. Errors on scales ϑ ≳ 180 arcmin are thus likely to be underestimated for GAMA correlations.
Current usage metrics show cumulative count of Article Views (full-text article views including HTML views, PDF and ePub downloads, according to the available data) and Abstracts Views on Vision4Press platform.
Data correspond to usage on the plateform after 2015. The current usage metrics is available 48-96 hours after online publication and is updated daily on week days.
Initial download of the metrics may take a while.