Fig. 9
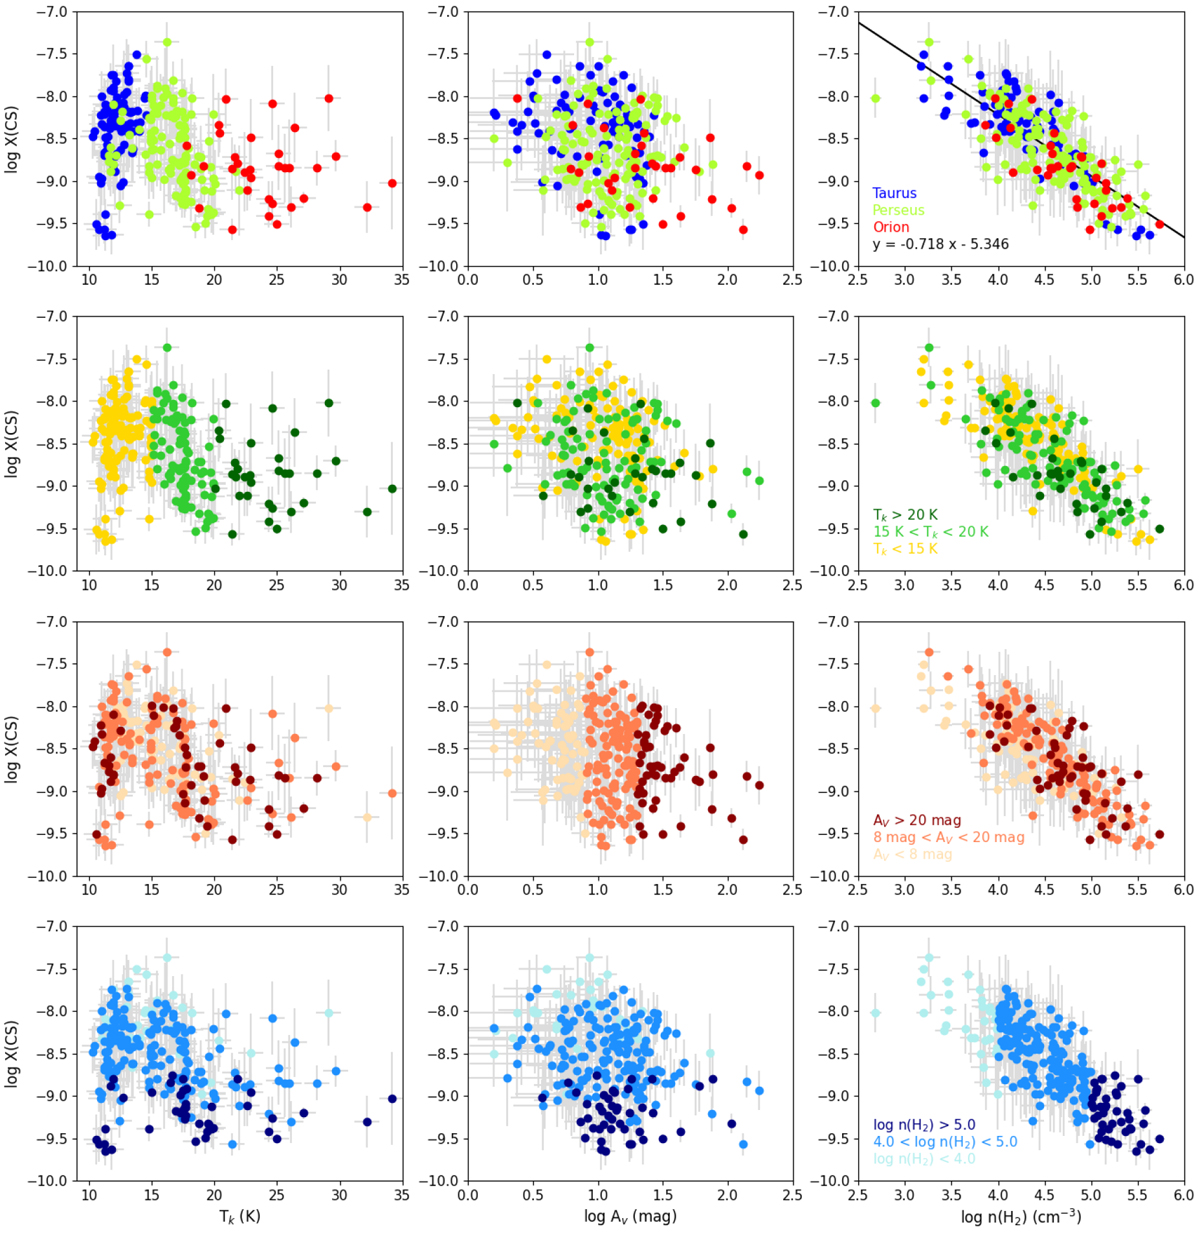
Relation of the CS molecular abundance to cloud physical parameters: kinetic temperature (left column), extinction (middle column), and molecular hydrogen density (right column). From top to bottom, the dataset is color-coded according to the molecular cloud of the points (first row), bins of kinetic temperature (second row), bins of extinction (third row), and bins of molecular hydrogen density (last row), as indicated in the corresponding legends. The black line in the top right plot shows the linear correlation between X(CS) and n(H2) for the whole sample, with the correlation parameters indicated in the legend.
Current usage metrics show cumulative count of Article Views (full-text article views including HTML views, PDF and ePub downloads, according to the available data) and Abstracts Views on Vision4Press platform.
Data correspond to usage on the plateform after 2015. The current usage metrics is available 48-96 hours after online publication and is updated daily on week days.
Initial download of the metrics may take a while.