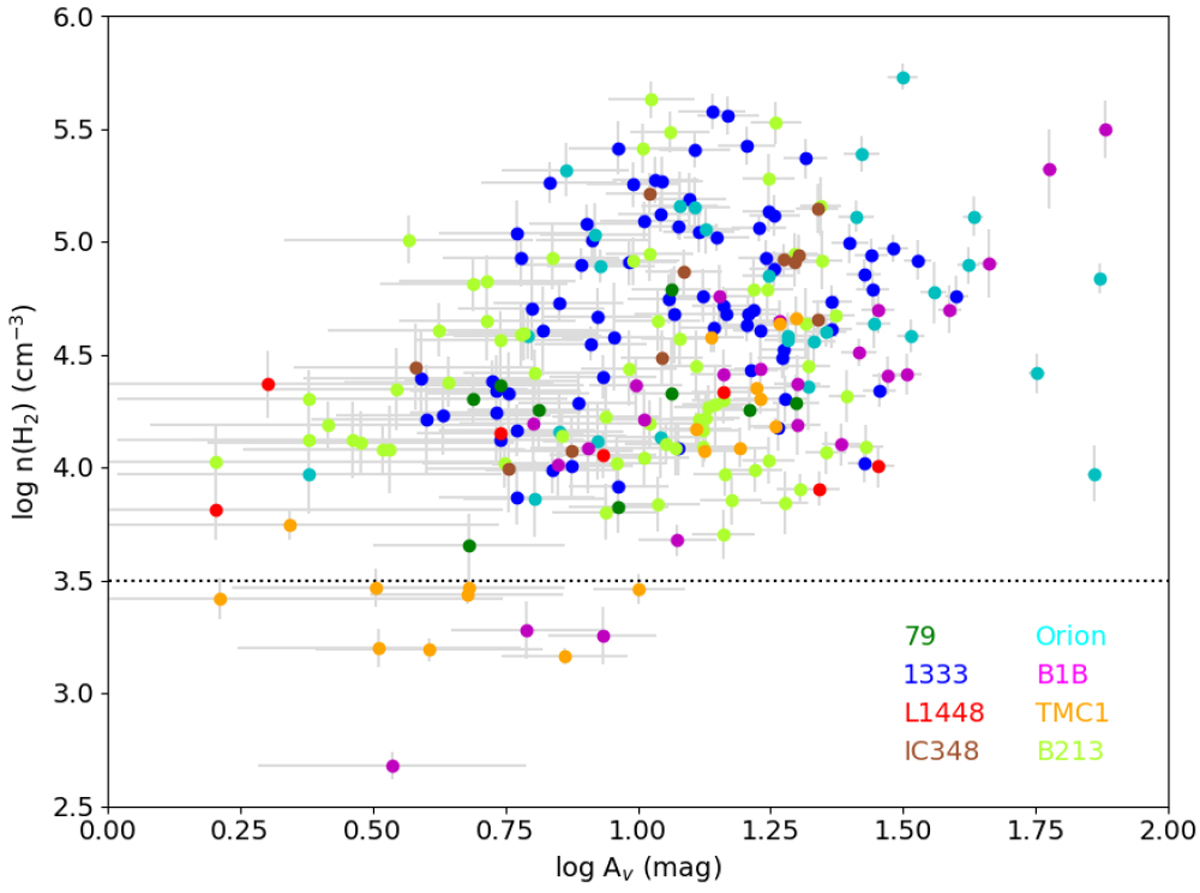
Fig. 7

Relation between derived molecular hydrogen densities and visual extinctions for the sample used in this study. Colors indicate the different observed regions as shown in the plot legend. Densities <3 × 103 cm−3 are only measured in TMC 1 and Barnard 1b as a consequence of our methodology and the limitations of our dataset, which is incomplete for the rest of the regions (see text). This value is marked with a dotted horizontal line.
Current usage metrics show cumulative count of Article Views (full-text article views including HTML views, PDF and ePub downloads, according to the available data) and Abstracts Views on Vision4Press platform.
Data correspond to usage on the plateform after 2015. The current usage metrics is available 48-96 hours after online publication and is updated daily on week days.
Initial download of the metrics may take a while.


