Fig. 20
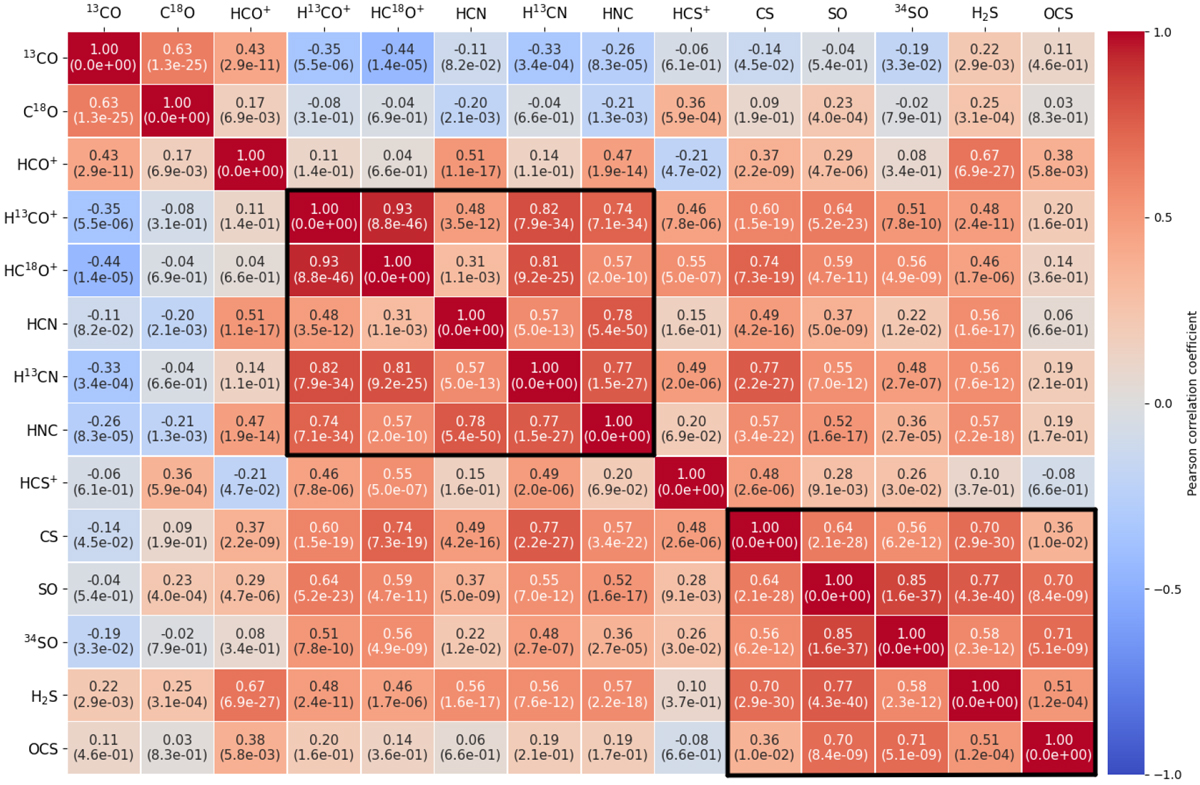
Pearson correlation coefficients of the relations between the molecular abundances of the studied species. Numbers in brackets correspond to the null hypothesis probability in each case, i.e. probability of no relation between variables, where a value higher than 0.001 is considered to indicate no relation at all. Black rectangles indicate groups of molecules with strong correlations (see text).
Current usage metrics show cumulative count of Article Views (full-text article views including HTML views, PDF and ePub downloads, according to the available data) and Abstracts Views on Vision4Press platform.
Data correspond to usage on the plateform after 2015. The current usage metrics is available 48-96 hours after online publication and is updated daily on week days.
Initial download of the metrics may take a while.