Fig. 16
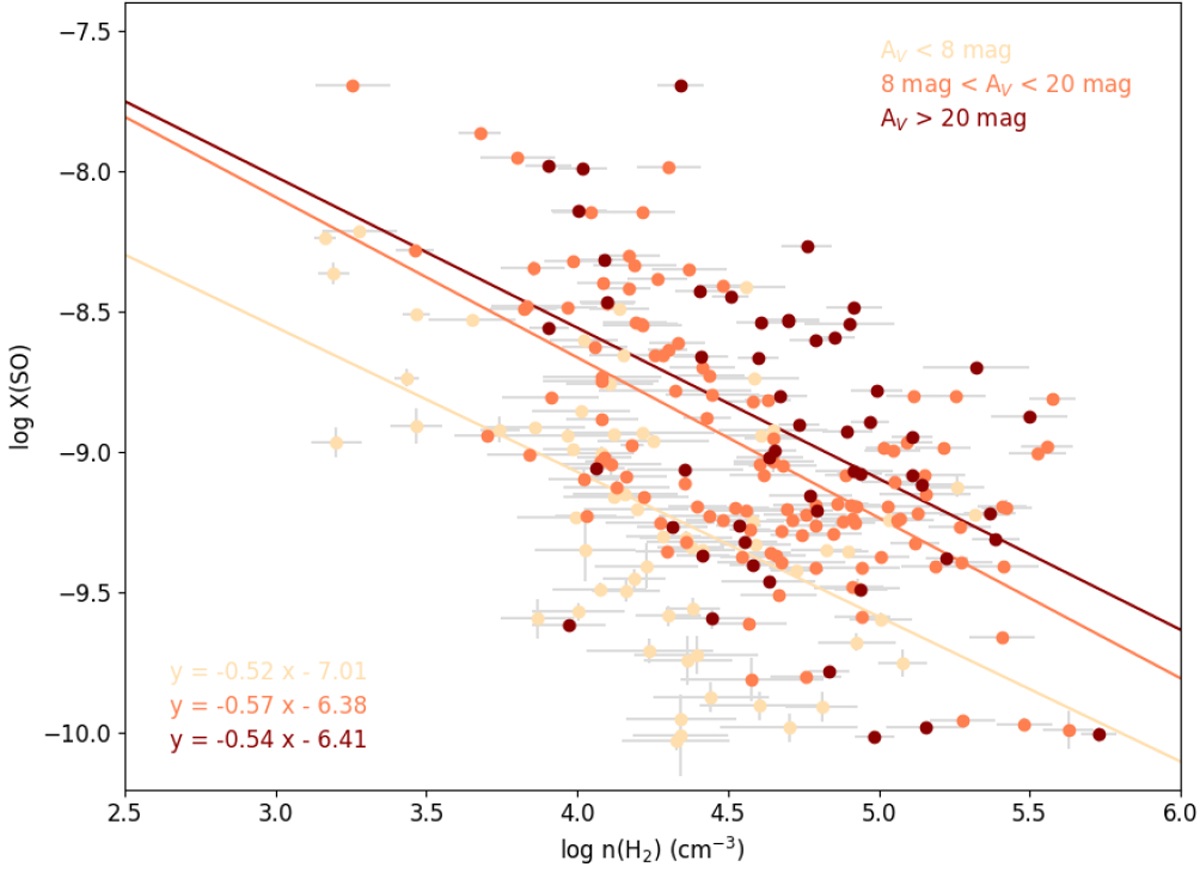
Relation of the SO molecular abundance to the molecular hydrogen density. The dataset is color-coded considering bins of extinction, as indicated in the legend. Lines show the linear correlations between molecular abundances and molecular hydrogen density for each extinction bin, with the correlation parameters indicated in the legend.
Current usage metrics show cumulative count of Article Views (full-text article views including HTML views, PDF and ePub downloads, according to the available data) and Abstracts Views on Vision4Press platform.
Data correspond to usage on the plateform after 2015. The current usage metrics is available 48-96 hours after online publication and is updated daily on week days.
Initial download of the metrics may take a while.