Fig. 9.
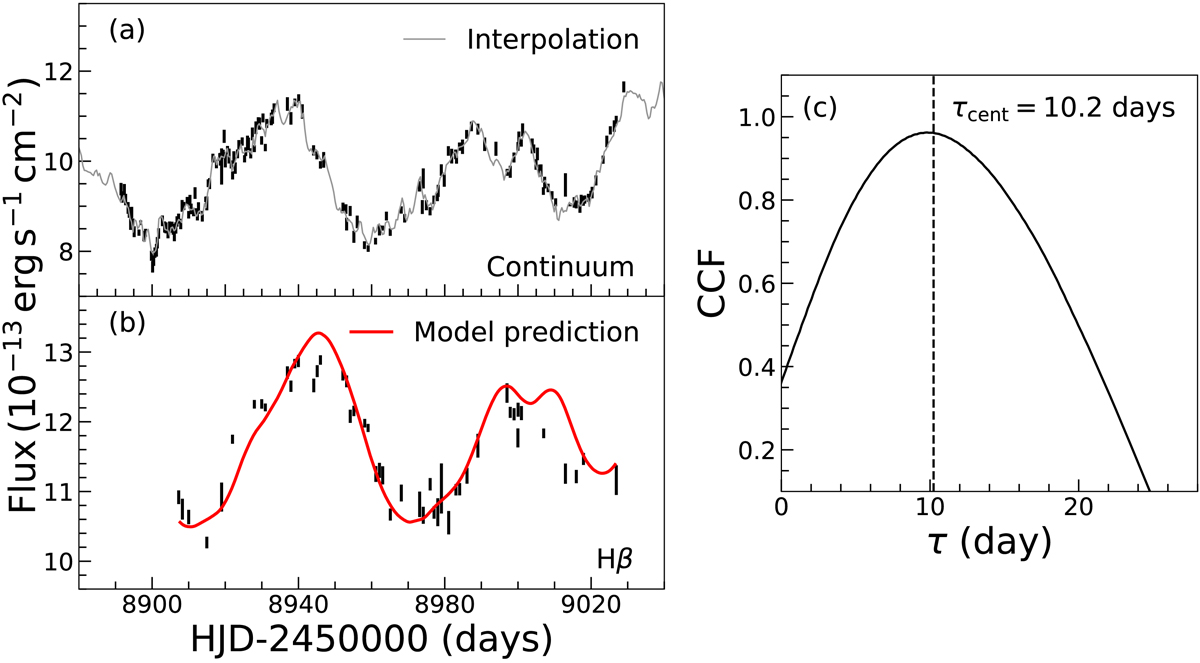
Panel a: observed continuum light curve from Bentz et al. (2021) (black points) with the finer sampled interpolated continuum light curve over-plotted (grey line). Panel b: observed broad emission-line light curve (black points) with the emission-line light curve produced by reverberating the input continuum light curve off the clouds in our best-fit BLR model (red). Panel c: cross-correlation function between the continuum and broad emission-line light curves as a function of time-lag. The dashed line indicates the peak cross-correlation time-lag of 10.2 days.
Current usage metrics show cumulative count of Article Views (full-text article views including HTML views, PDF and ePub downloads, according to the available data) and Abstracts Views on Vision4Press platform.
Data correspond to usage on the plateform after 2015. The current usage metrics is available 48-96 hours after online publication and is updated daily on week days.
Initial download of the metrics may take a while.