Fig. 8.
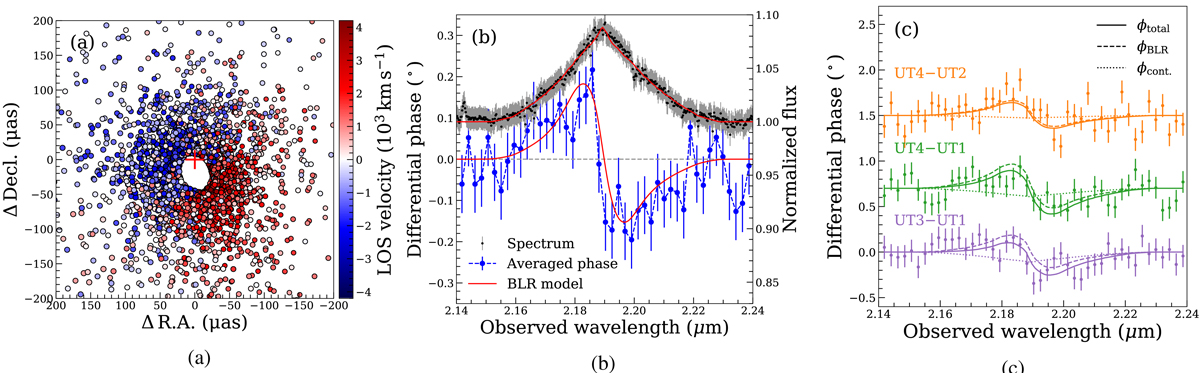
Panel a: cloud distribution of the best-fit BLR model. Each circle represents one cloud colour-coded by the LOS velocity. The green ellipse at the origin illustrates the uncertainty of the offset of the BLR centre. Panel b: observed averaged differential phase from baselines UT4−UT2, UT4−UT1, and UT3−UT1 after removing the residual ‘continuum phase’ signal (blue points) compared to the averaged differential phase from the best-fit BLR model (lower red line). The black points and overlaid red line show the observed and best model line flux profile respectively. Panel c: averaged differential phase data (points) and the best-fit models (lines) of the three baselines that show the strongest signal of the BLR component (dashed lines). The phase in panel b is calculated by averaging the phases of these three baselines after subtracting the best-fit residual continuum phases (dotted lines).
Current usage metrics show cumulative count of Article Views (full-text article views including HTML views, PDF and ePub downloads, according to the available data) and Abstracts Views on Vision4Press platform.
Data correspond to usage on the plateform after 2015. The current usage metrics is available 48-96 hours after online publication and is updated daily on week days.
Initial download of the metrics may take a while.