Fig. 7.
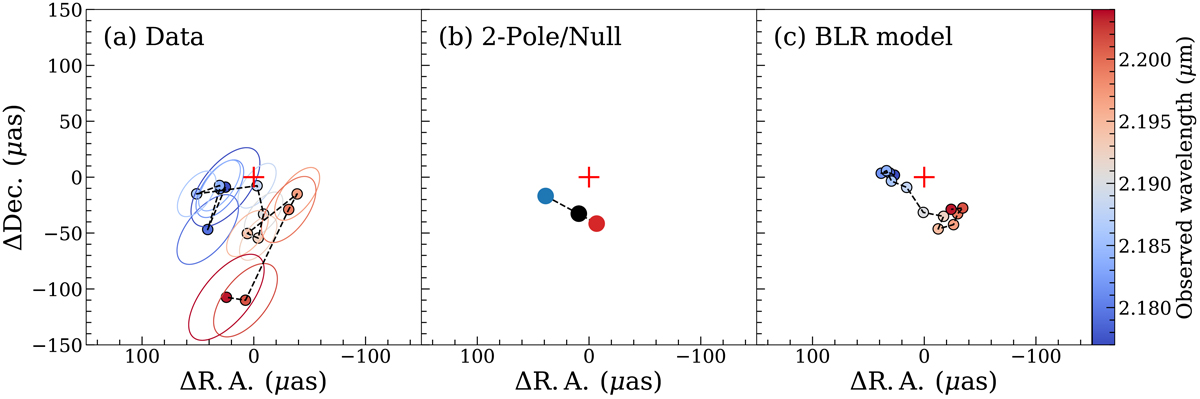
Panel a: best-fit photocentres for the 13 brightest spectral channels covering the Brγ line to the differential phase data. The colour indicates wavelength and the ellipses outline the uncertainty on the photocentres. The red cross plots the (0,0) position. Panel b: best fit ‘2-pole’ photocentre model where all blueshifted (blue point) and redshifted (red point) channels are assumed to have the same photocentre with the addition of the wavelength-independent offset. The black point indicates the best-fit position of the ‘null’ model where all channels are assumed to have the same photocentre. Panel c: photocentres produced from our best-fitting BLR model (see Sect. 3.2) which we calculated by first producing mock differential phase spectra before fitting them in the same way as panel a. Colours are the same as in panel a.
Current usage metrics show cumulative count of Article Views (full-text article views including HTML views, PDF and ePub downloads, according to the available data) and Abstracts Views on Vision4Press platform.
Data correspond to usage on the plateform after 2015. The current usage metrics is available 48-96 hours after online publication and is updated daily on week days.
Initial download of the metrics may take a while.