Fig. 6.
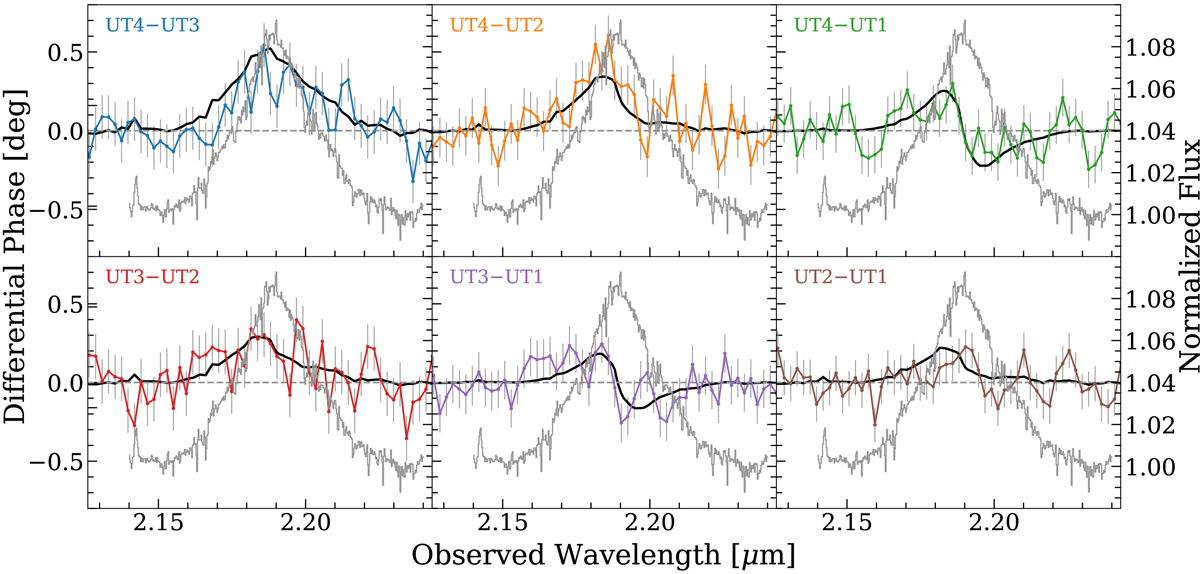
Baseline averaged differential phase spectra spanning the Brγ line (coloured points and grey error bars). The grey profile in each panel plots the same normalised Brγ spectrum from SINFONI with the narrow component removed. The black curves represent the best-fit BLR model summed with the continuum phase calculated from our image reconstruction. The model line profile appears noisy because of the continuum phase contribution being calculated based on the observed line profile.
Current usage metrics show cumulative count of Article Views (full-text article views including HTML views, PDF and ePub downloads, according to the available data) and Abstracts Views on Vision4Press platform.
Data correspond to usage on the plateform after 2015. The current usage metrics is available 48-96 hours after online publication and is updated daily on week days.
Initial download of the metrics may take a while.