Fig. 2.
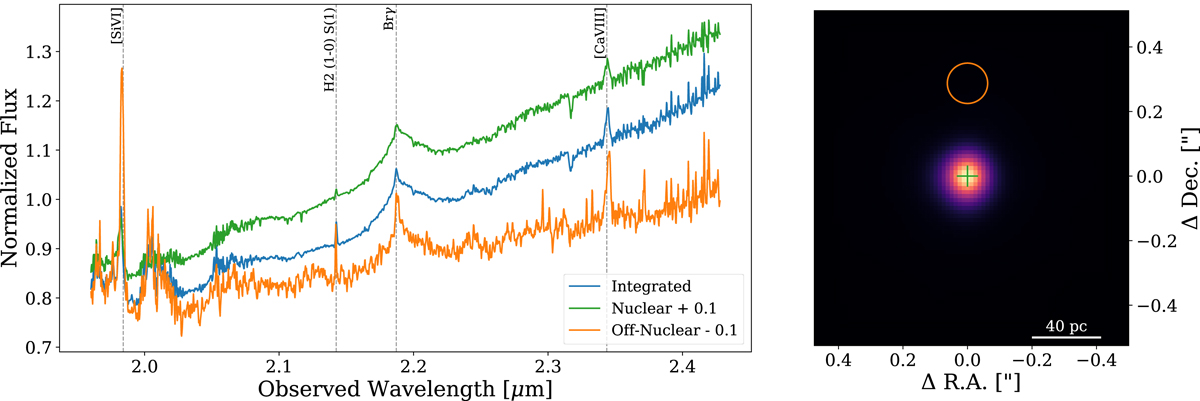
Left: example spectra extracted from the SINFONI cube including the full integrated spectrum (blue), a spectrum from a nuclear spaxel (green), and an integrated spectrum from an off-nuclear region (orange). All spectra have been normalised to their median flux and slightly offset to improve visualisation. Right: K-band continuum image created by integrating the SINFONI cube between 2.25 and 2.31 μm. The green cross indicates the spaxel used for the nuclear spectrum in the right panel. The orange circle indicates the aperture used for the off-nuclear spectrum.
Current usage metrics show cumulative count of Article Views (full-text article views including HTML views, PDF and ePub downloads, according to the available data) and Abstracts Views on Vision4Press platform.
Data correspond to usage on the plateform after 2015. The current usage metrics is available 48-96 hours after online publication and is updated daily on week days.
Initial download of the metrics may take a while.