Fig. 18.
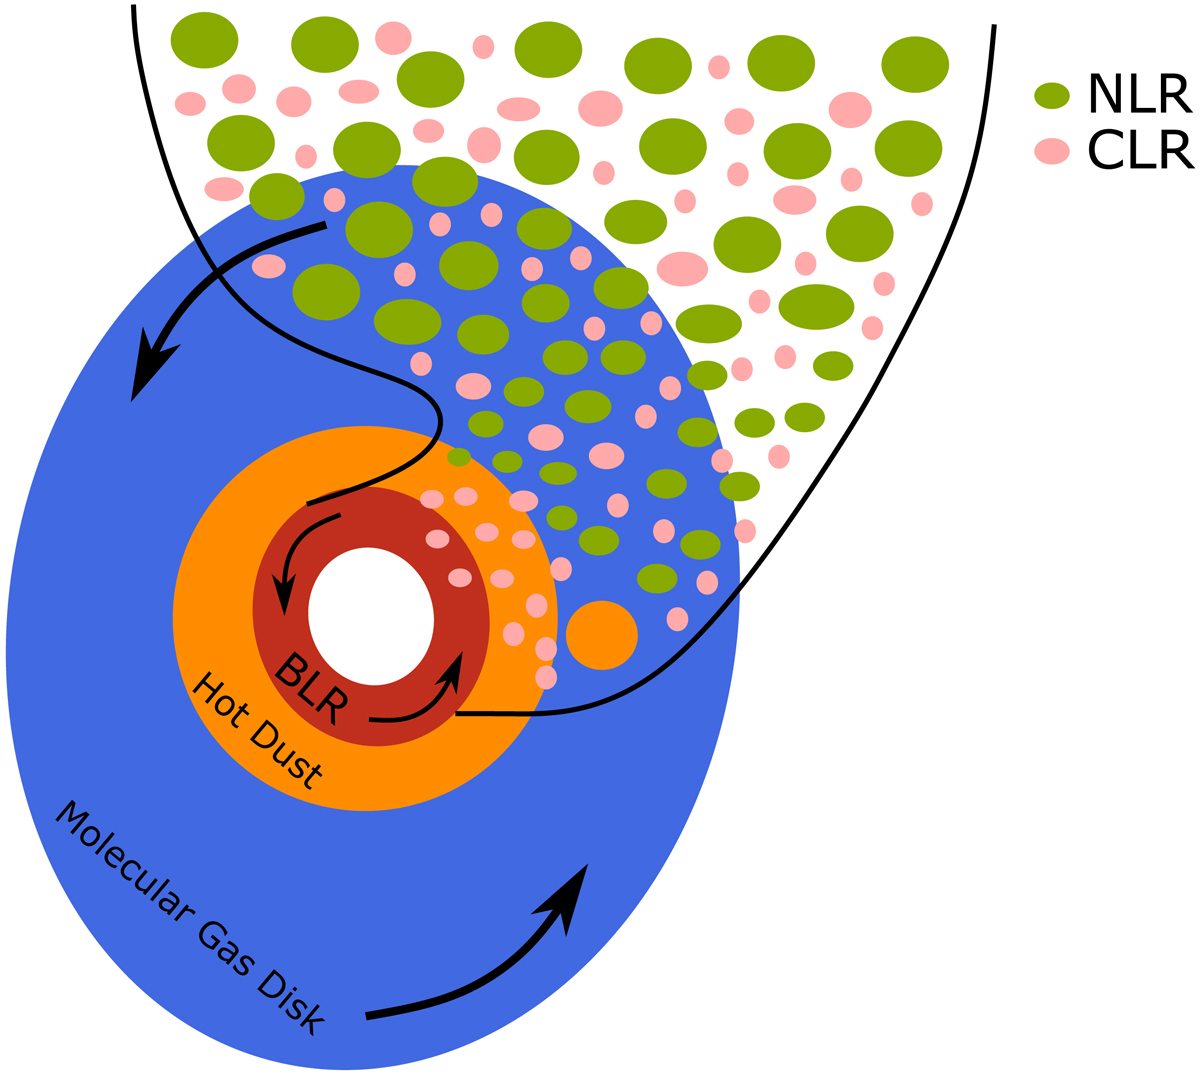
Cartoon of the nuclear and circumnuclear region as described in Sect. 6. Different coloured clouds within the ionisation cone correspond to coronal and narrow-emission-line-emitting clouds. Arrows for the BLR and molecular gas disc indicate the direction of rotation. The image is not to scale in order to be able to show all components together.
Current usage metrics show cumulative count of Article Views (full-text article views including HTML views, PDF and ePub downloads, according to the available data) and Abstracts Views on Vision4Press platform.
Data correspond to usage on the plateform after 2015. The current usage metrics is available 48-96 hours after online publication and is updated daily on week days.
Initial download of the metrics may take a while.