Fig. 17.
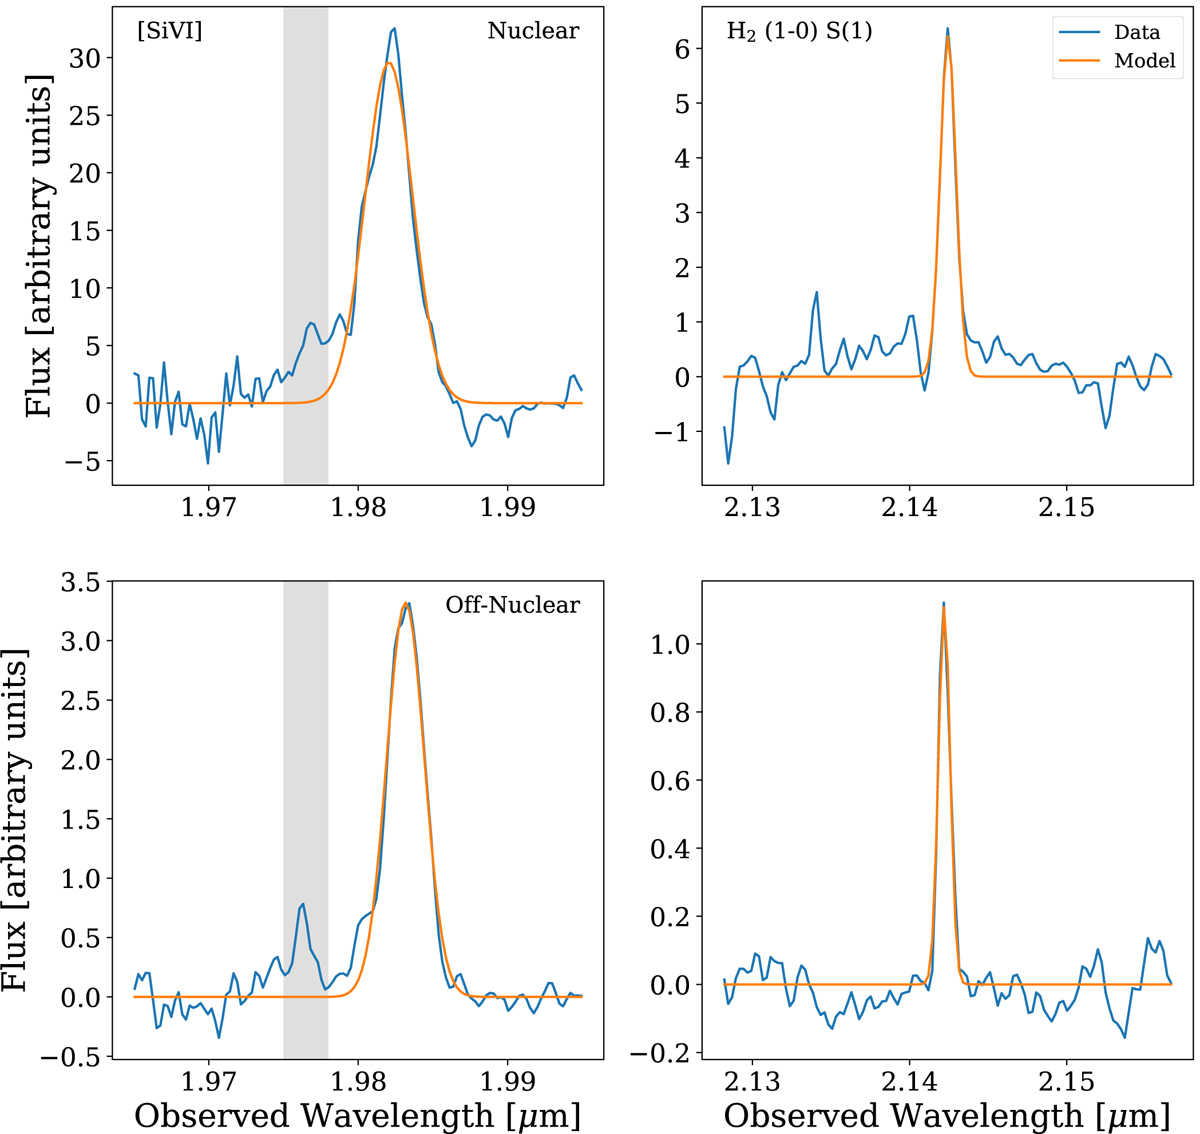
Example fits to individual spectra for the [Si VI] (left panels) and H2 (1–0) S(1) line (right panels). The observed spectra are shown in blue while the best-fit Gaussian models are shown in orange. Top row: spectral regions from a nuclear pixel, bottom row: spectral regions from an off-nuclear pixel. The specific pixels used are shown as white crosses in Fig. 16. The grey shaded region in the [Si VI] panels show the masked region corresponding to the expected location of the H2 (1–0) S(3).
Current usage metrics show cumulative count of Article Views (full-text article views including HTML views, PDF and ePub downloads, according to the available data) and Abstracts Views on Vision4Press platform.
Data correspond to usage on the plateform after 2015. The current usage metrics is available 48-96 hours after online publication and is updated daily on week days.
Initial download of the metrics may take a while.