Fig. 13.
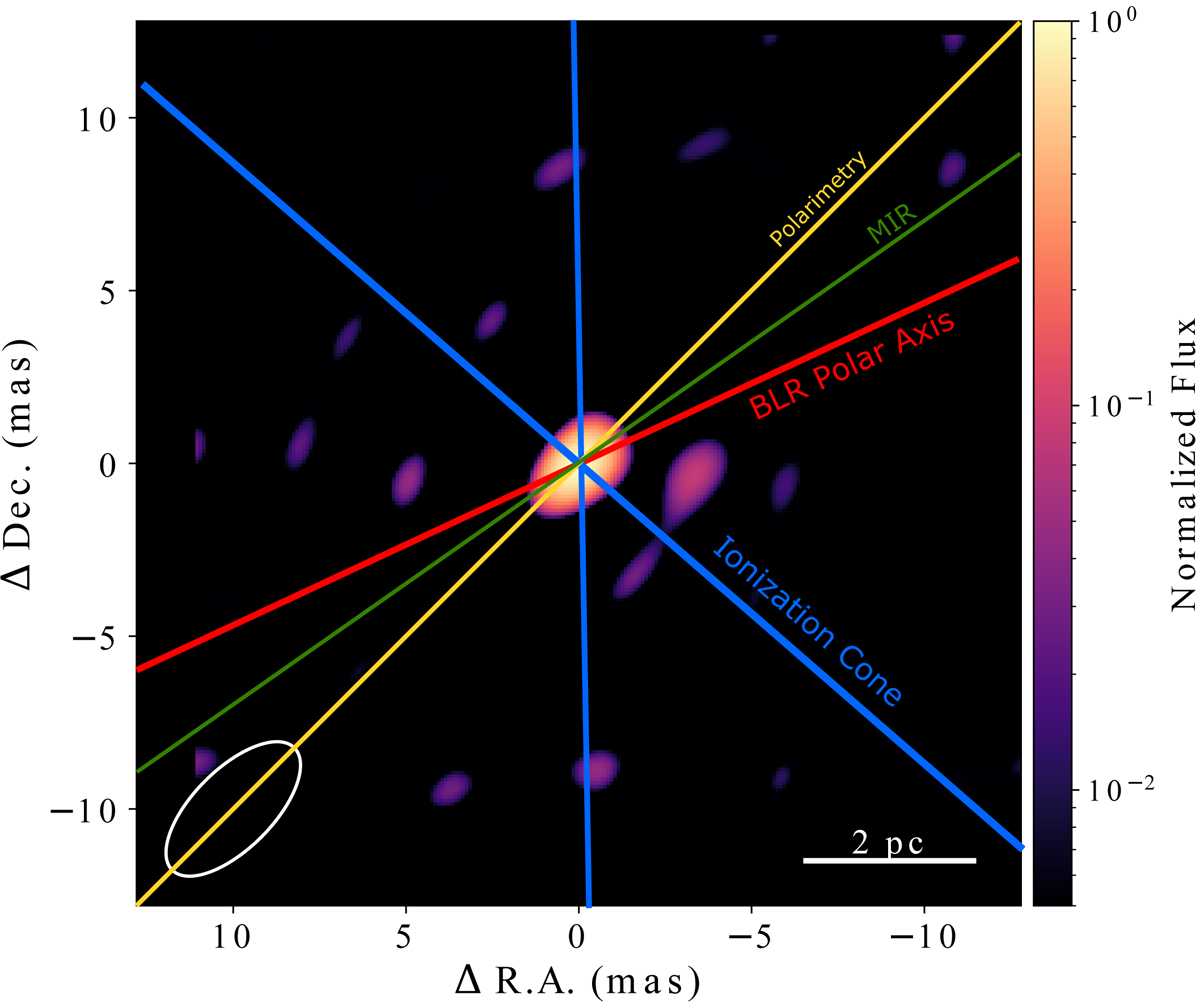
Same as Fig. 12 but with lines indicating important angles and regions. Blue lines outline the ionisation cone as produced by the BLR polar axis (red line) and thickness. The yellow line indicates the position angle from polarimetery (Lira et al. 2020) and the green line indicates the position angle from mid-IR interferometry (Hönig et al. 2013).
Current usage metrics show cumulative count of Article Views (full-text article views including HTML views, PDF and ePub downloads, according to the available data) and Abstracts Views on Vision4Press platform.
Data correspond to usage on the plateform after 2015. The current usage metrics is available 48-96 hours after online publication and is updated daily on week days.
Initial download of the metrics may take a while.