Fig. 6.
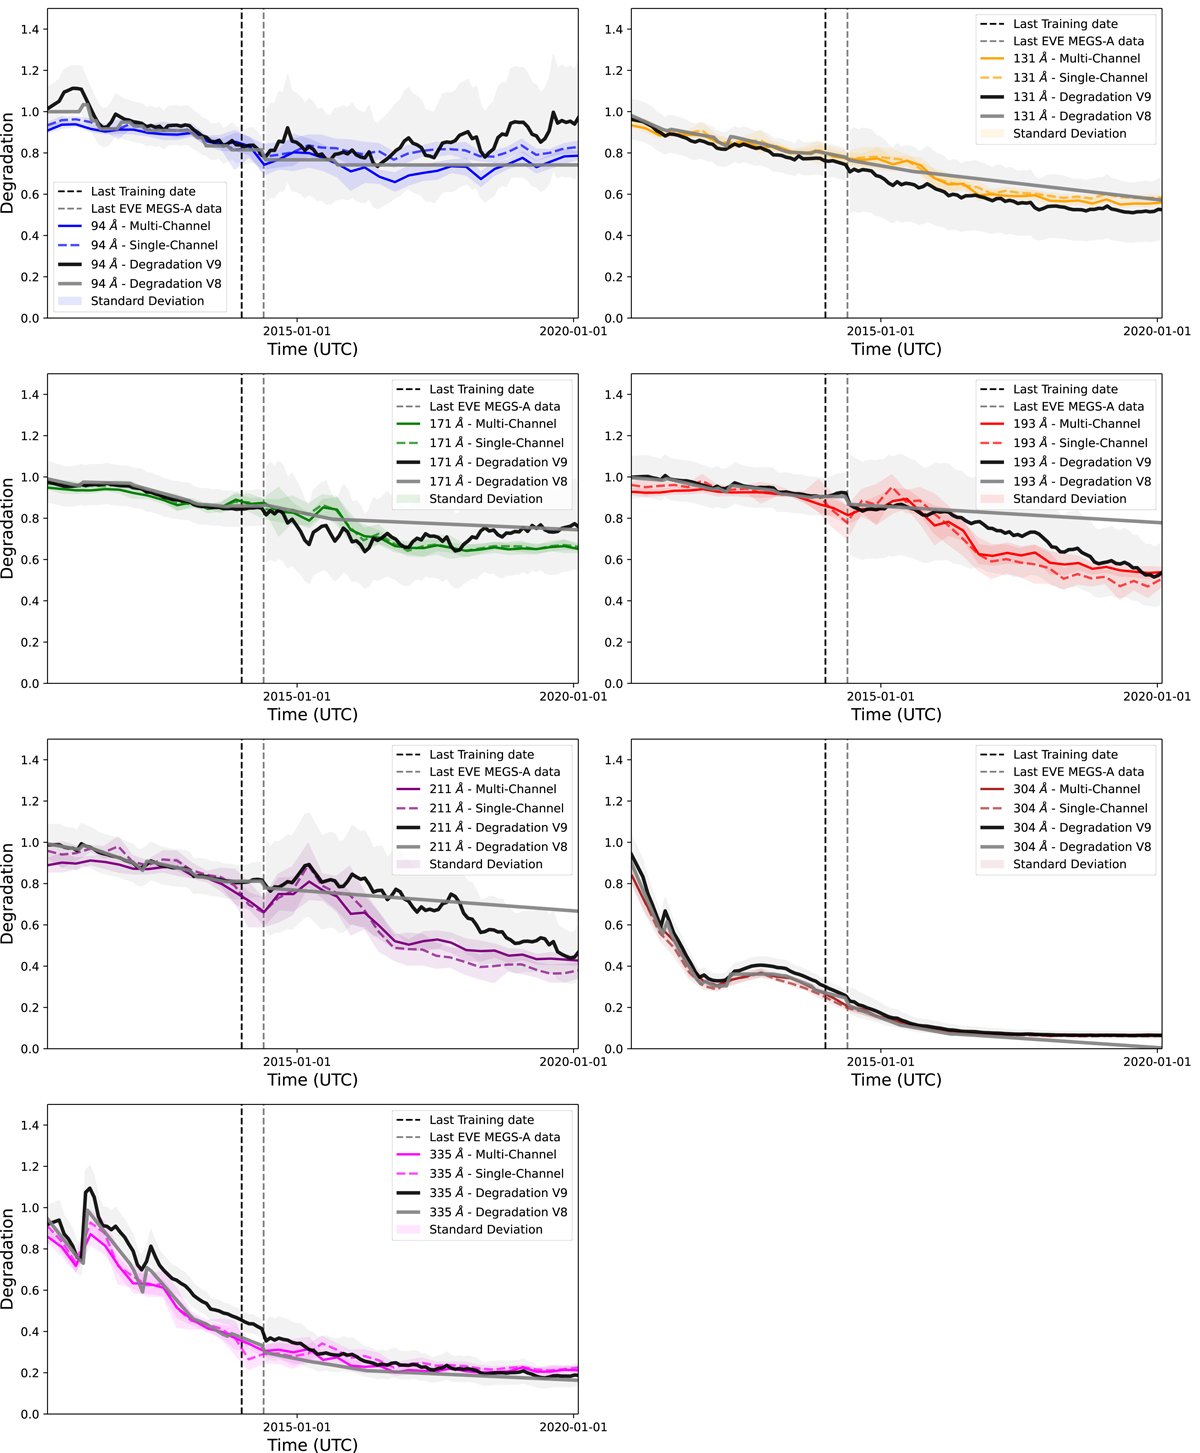
Channel degradation over time. From top to bottom: Channel 94 Å (blue), 131 Å (yellow), 171Å (green), 193 Å (red), 211 Å (purple), 304 Å (brown), and 335 Å (magenta). The solid black (gray) curve is the degradation profile of AIA calibration release V9 (V8). The gray shaded area correspond to the error (10% earlier than May 2014 and 28% error later) of the degradation curve V9. The colored shaded areas are the standard deviation of the CNN models. The vertical dashed black line is the last available observation from EVE MEGS-A data, and the vertical dashed gray line is the last training date.
Current usage metrics show cumulative count of Article Views (full-text article views including HTML views, PDF and ePub downloads, according to the available data) and Abstracts Views on Vision4Press platform.
Data correspond to usage on the plateform after 2015. The current usage metrics is available 48-96 hours after online publication and is updated daily on week days.
Initial download of the metrics may take a while.