Fig. 6.
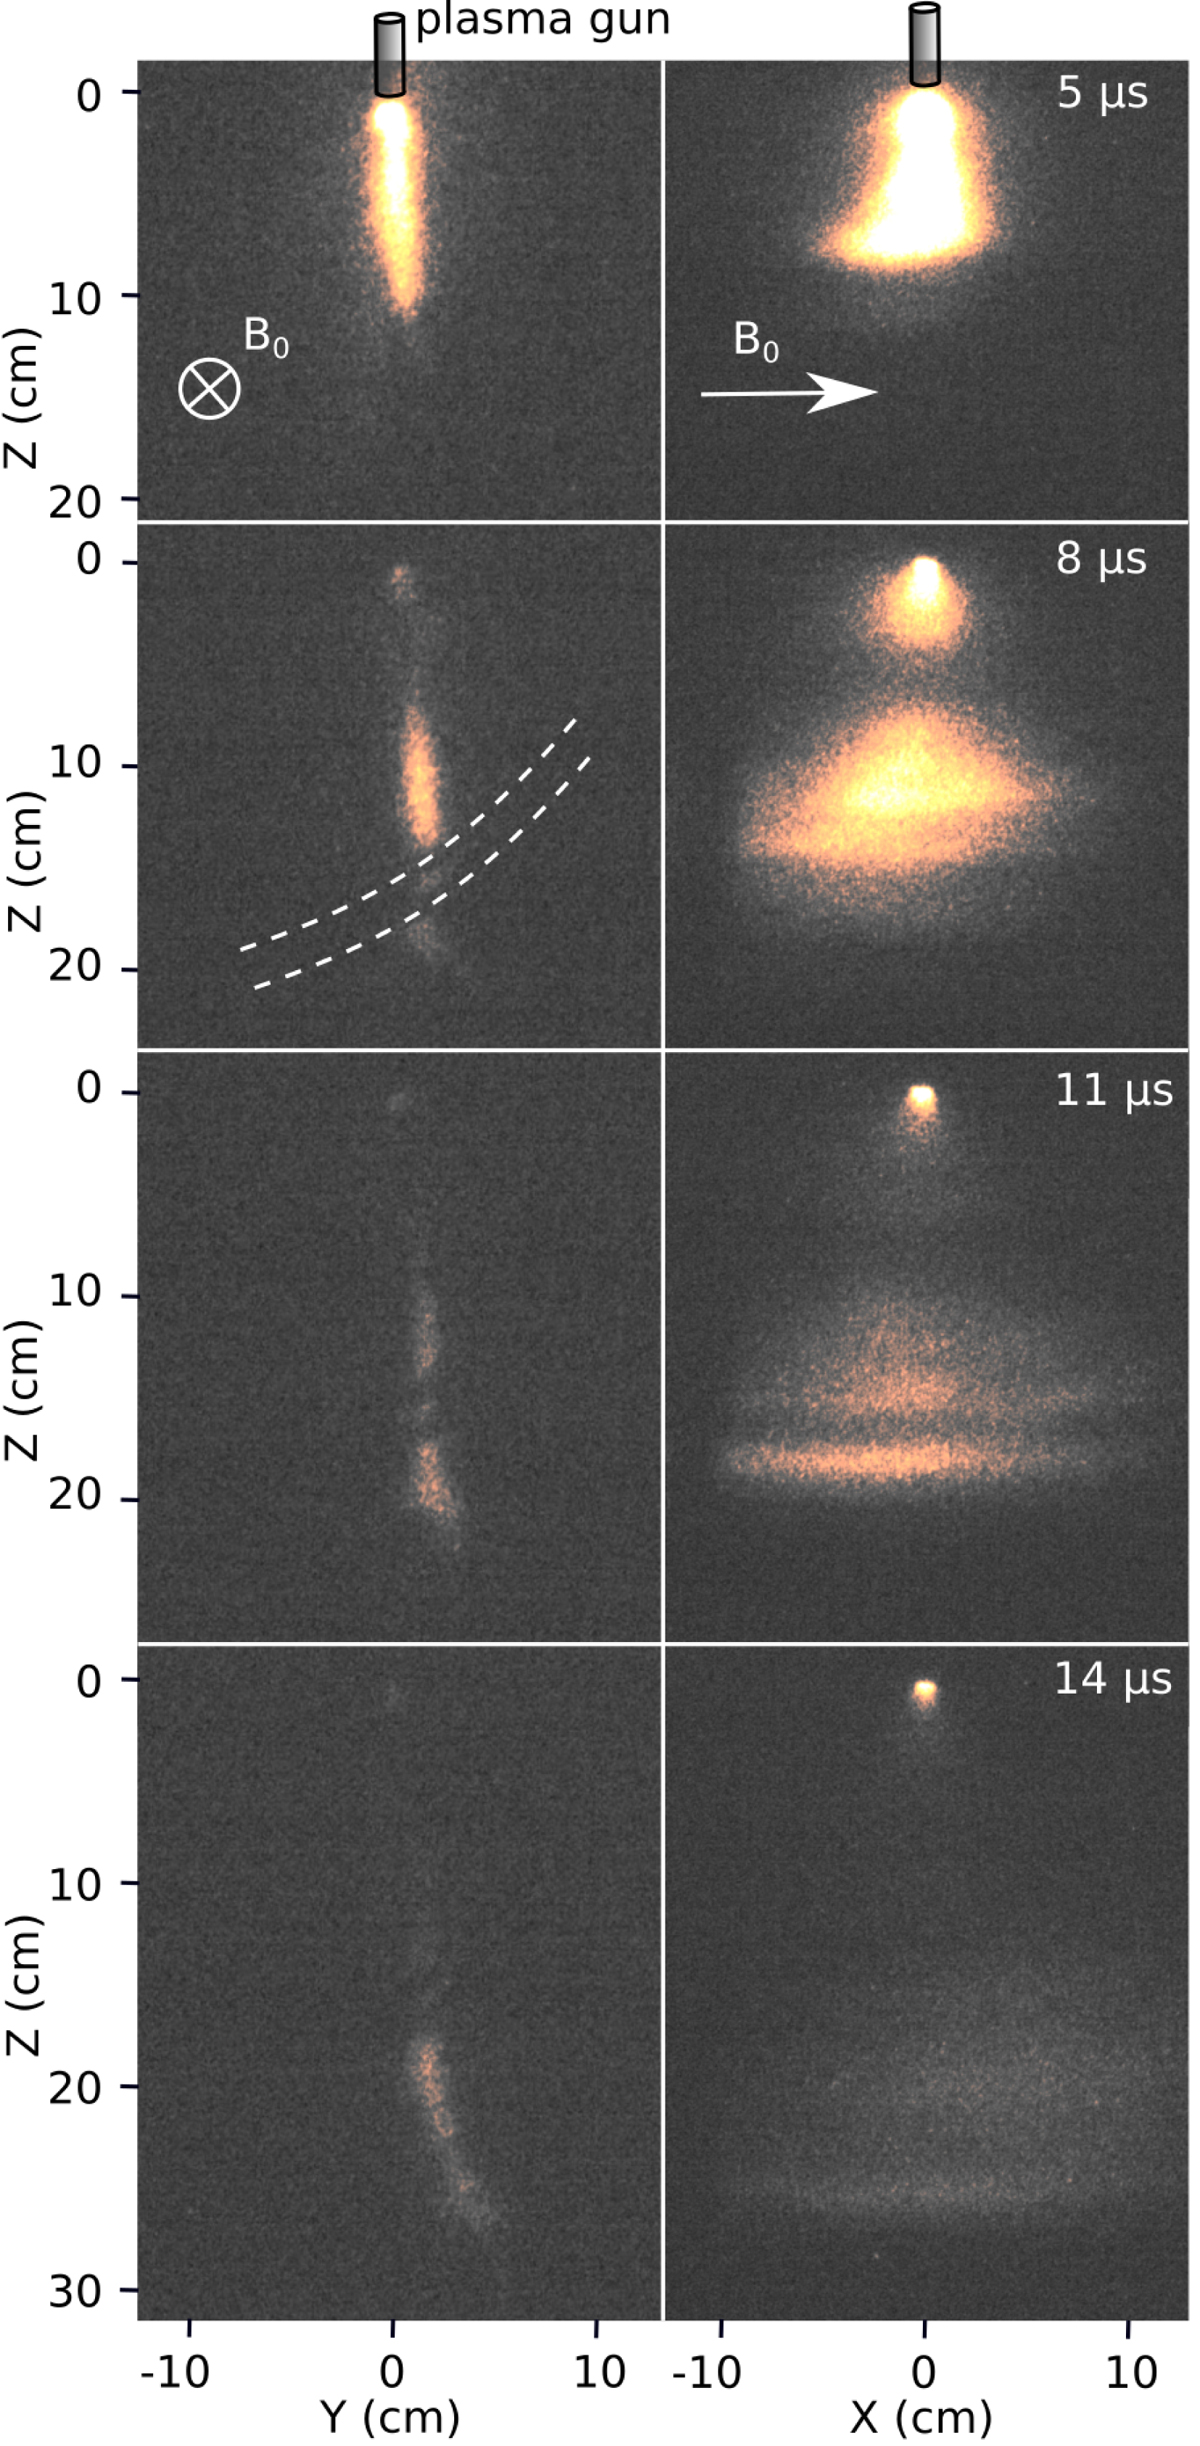
Images of the self-emission of the plasma-gun generated flow (in the case in which the applied magnetic field strength is 450 G), at various times after the start of injection (as indicated) and in the yz (left column) and xz (right column) planes. The dashed lines denote the location of a cable line placed between the plasma flow and the observation camera, hence locally obscuring the flow.
Current usage metrics show cumulative count of Article Views (full-text article views including HTML views, PDF and ePub downloads, according to the available data) and Abstracts Views on Vision4Press platform.
Data correspond to usage on the plateform after 2015. The current usage metrics is available 48-96 hours after online publication and is updated daily on week days.
Initial download of the metrics may take a while.