Fig. 3
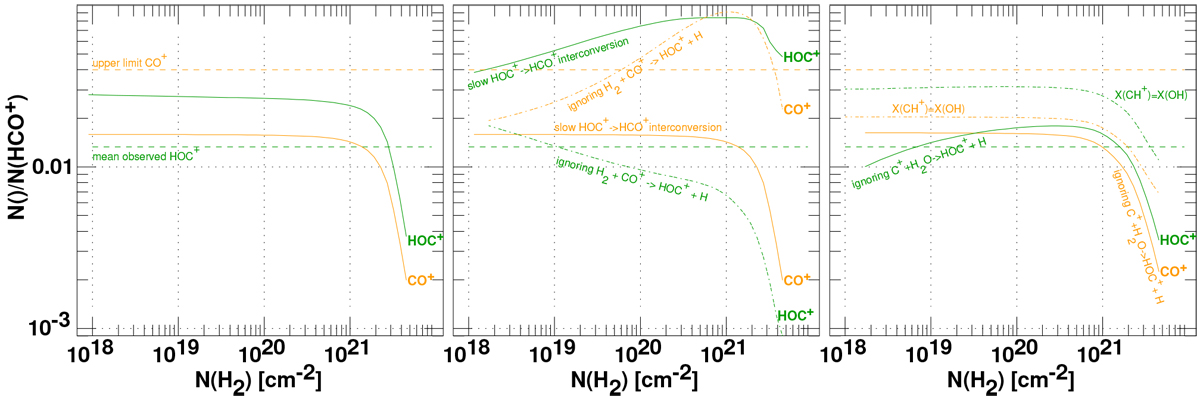
Models of thermal chemistry for the relative abundances N(CO+)/N(HCO+) and N(HOC+)/N(HCO+) with default rates to the left, and deviations in the middle and right panels. In all panels, results for HOC+ are shown in green and for CO+ in orange. In all cases, N(HCO+) is taken to be the observed value N(HCO+) = 3 × 10⁻⁹ N(H2). Left panel: baseline models with the observed upper limit for N(CO+)/N(HCO+) from this work and the mean N(HOC+)/N(HCO+) ratio from Gerin et al. (2019) are illustrated schematically as horizontal dashed lines. Middle panel: the solid lines represent the case that the rate constant of H2 + HOC+ → HOC+ +H2 interconversion is taken as 10−11cm3 s−1. The dashed-dotted lines represent model results when the rate constant for the reaction H2 + CO+ → HOC+ + H is set to 0. Right panel: the solid lines show models in which the reaction of C+ and H2O does not form HOC+ and the dashed-dotted lines show model results when CH+ is as abundant as OH, X(CH+) = 10−7.
Current usage metrics show cumulative count of Article Views (full-text article views including HTML views, PDF and ePub downloads, according to the available data) and Abstracts Views on Vision4Press platform.
Data correspond to usage on the plateform after 2015. The current usage metrics is available 48-96 hours after online publication and is updated daily on week days.
Initial download of the metrics may take a while.