Fig. 4
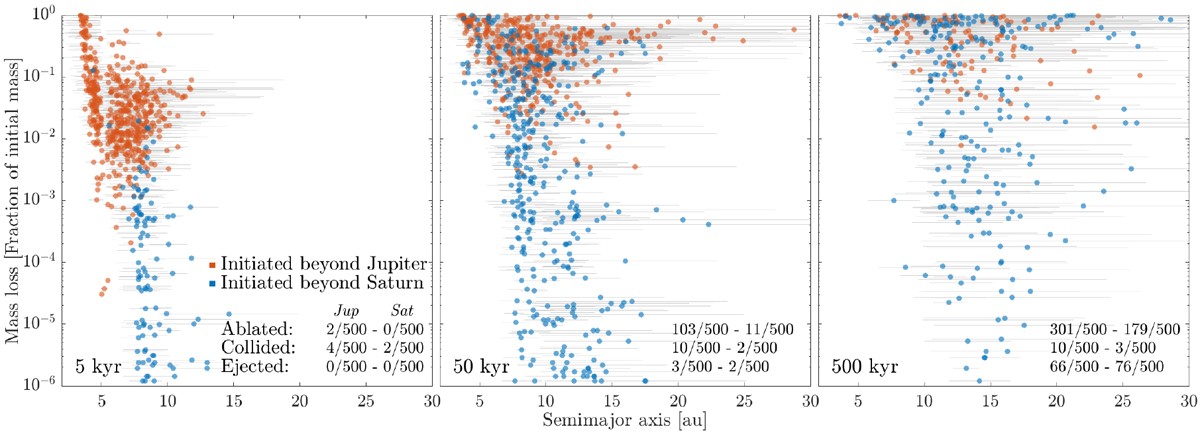
Mass loss versus semimajor axis evolution for the 1000 planetesimals in the nominal Solar System simulation (same data as in Figs. 1 and 2). The thin grey lines mark the perihelion and aphelion of the planetesimal orbits. The number of planetesimals formed at Jupiter’s (red dots) respective Saturn’s (blue dots) gap edge which do not appear on the plot, because they have been either: completely ablated; collided with a planet; or ejected beyond the simulations domain, is written in each panel. Planetesimals formed at the gap edge of Jupiter generally experience more ablation than planetesimals formed at the gap edge of Saturn. About 50% of all planetesimals have become completely ablated after 500 kyr.
Current usage metrics show cumulative count of Article Views (full-text article views including HTML views, PDF and ePub downloads, according to the available data) and Abstracts Views on Vision4Press platform.
Data correspond to usage on the plateform after 2015. The current usage metrics is available 48-96 hours after online publication and is updated daily on week days.
Initial download of the metrics may take a while.