Fig. 3
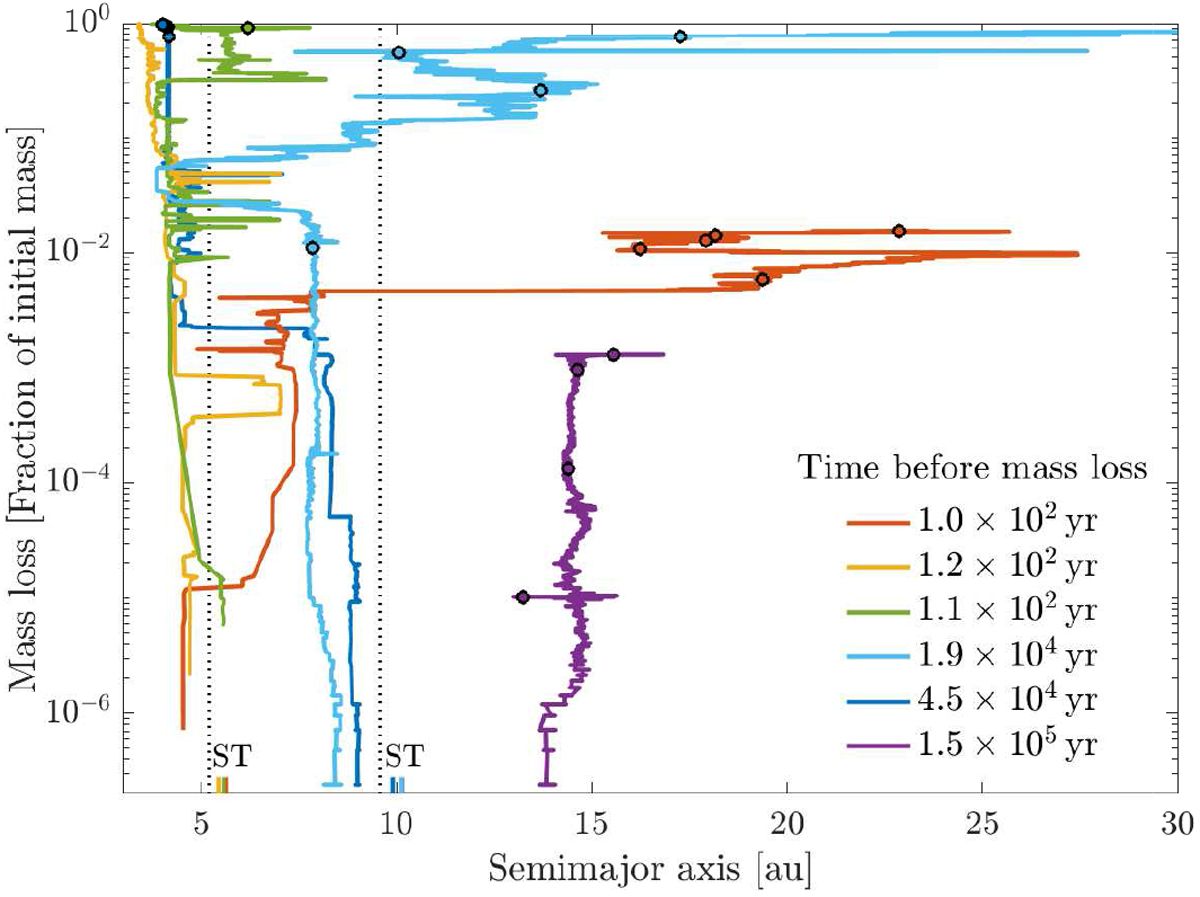
Mass loss versus semimajor axis for 6 selected planetesimals from the nominal Solar System simulation. The mass loss is calculated as 1 − M(t)∕M(t = 0). Filled circlesmark 100 kyr of evolution and the formation location of the planetesimals (shown at the bottom of the plot) has been marked “ST”. The time before the planetesimals first experience mass loss, that is, the time before they appear on the plot, has been included in the legend. The first three legend entries are for planetesimals formed at the gap edge of Jupiter and the following three are for planetesimals formed at the gap edge of Saturn. The dotted lines mark the semimajor axis of Jupiter and Saturn. Planetesimals which are scattered interior of Jupiter’s orbit lose mass at a high rate, while those which are scattered exterior of Saturn’s orbit experience little mass loss.
Current usage metrics show cumulative count of Article Views (full-text article views including HTML views, PDF and ePub downloads, according to the available data) and Abstracts Views on Vision4Press platform.
Data correspond to usage on the plateform after 2015. The current usage metrics is available 48-96 hours after online publication and is updated daily on week days.
Initial download of the metrics may take a while.