Fig. 2
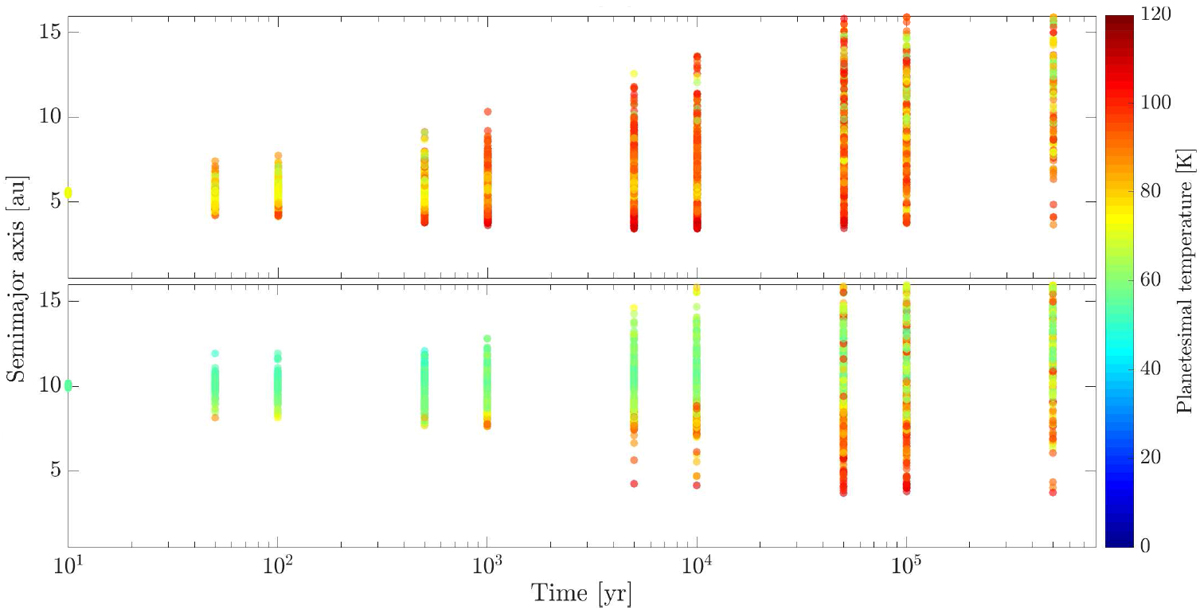
Semimajor axis and surface temperature evolution for the 1000 planetesimals in the nominal Solar System simulation (same data as in Fig. 1). For simulation times longer than 1 kyr, we average the semimajor axes over 100 yr and show the maximum surface temperatures during the same time period; whereas for shorter simulations times, we show non-averaged values. Upper panel: planetesimals formed at the gap edge of Jupiter and lower panel: planetesimals formed at the gap edge of Saturn. The close proximity to the giant planets result in continuous scatterings, which causes the fast semimajor axis diffusion that is displayed in the plot.
Current usage metrics show cumulative count of Article Views (full-text article views including HTML views, PDF and ePub downloads, according to the available data) and Abstracts Views on Vision4Press platform.
Data correspond to usage on the plateform after 2015. The current usage metrics is available 48-96 hours after online publication and is updated daily on week days.
Initial download of the metrics may take a while.