Fig. A.1
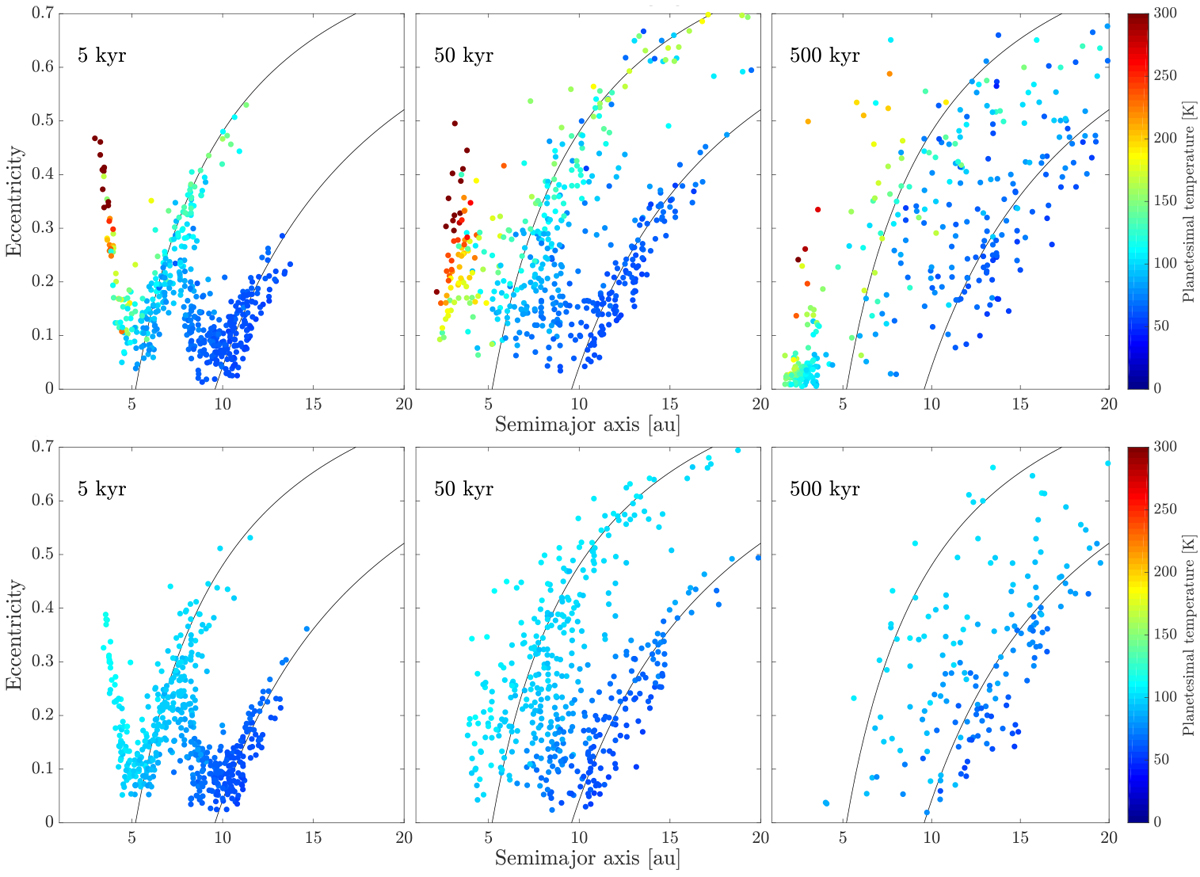
Comparison of nominal Solar System simulations without surface ablation (top panels), and with surface ablation (bottom panels). The temperature range in the plots is set to 0–300 K to allow for easy comparison; the hottest planetesimals in the top panels have surface temperatures of 443 K, 362 K, and 281 K, respectively, from left to right. The high temperatures obtained in the non-ablation simulations are due to the lack of cooling due to the release of latent heat of vaporization. The population of planetesimals with low eccentricities and short periods in the non-ablation simulations have been circularized by gas drag, these populations do not exist in the ablation simulations since they are removed by ablation before they become circularized.
Current usage metrics show cumulative count of Article Views (full-text article views including HTML views, PDF and ePub downloads, according to the available data) and Abstracts Views on Vision4Press platform.
Data correspond to usage on the plateform after 2015. The current usage metrics is available 48-96 hours after online publication and is updated daily on week days.
Initial download of the metrics may take a while.