Fig. 1
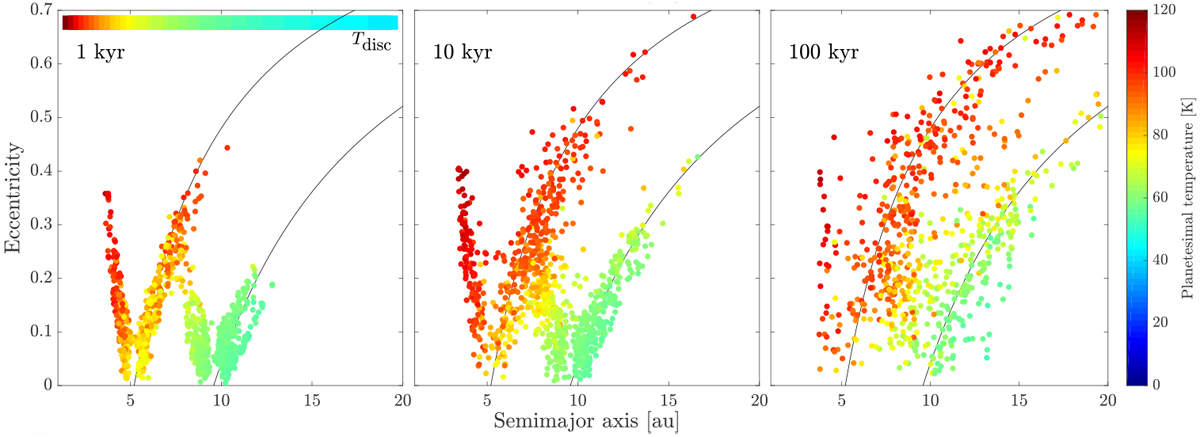
Eccentricity, semimajor axis, and surface temperature evolution for the 1000 planetesimals in the nominal Solar System simulation. The presented orbital parameters have been averaged over 100 yr and the surface temperatures are the maximum values during the same time period, which roughly corresponds to the surface temperatures at perihelion. The temperature of the surrounding gas (Tdisk) is shown as a colorbar in the left panel. The solid black lines mark the orbits with a perihelion corresponding to Jupiter’s and Saturn’s location. The planetesimals which cluster around these lines are (at least momentarily) members of Jupiter’s or Saturn’s scattered disk. Planetesimals that are scattered interior of Jupiter’s orbit obtain high surface temperatures at perihelion and experience efficient ablation.
Current usage metrics show cumulative count of Article Views (full-text article views including HTML views, PDF and ePub downloads, according to the available data) and Abstracts Views on Vision4Press platform.
Data correspond to usage on the plateform after 2015. The current usage metrics is available 48-96 hours after online publication and is updated daily on week days.
Initial download of the metrics may take a while.