Fig. 6.
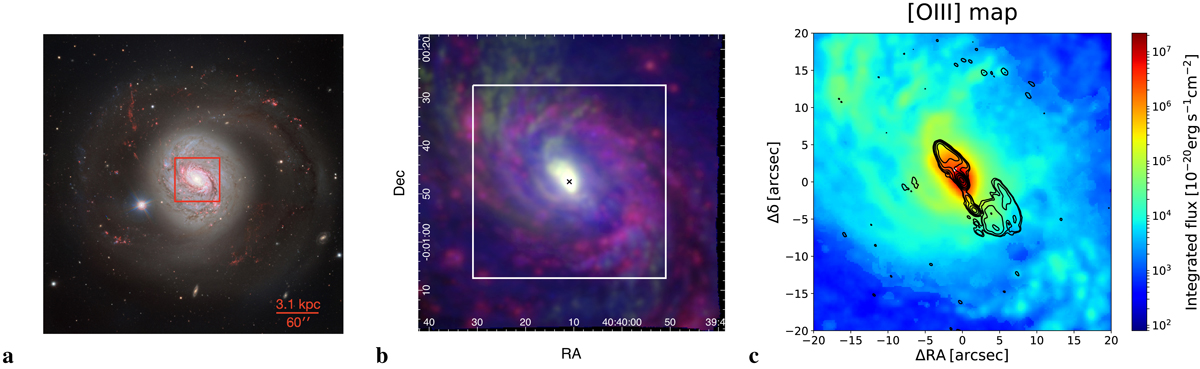
NGC 1068. (a) Four-colour image of NGC 1068 from FORS2 at the VLT, where emission in b, v, and R filters is reported in blue, green, and orange, respectively, and Hα in red; credit: ESO. The red box shows the FOV of our MUSE map in panel b, whose side spans ∼3.3 kpc. Same as in Fig. 1 for (b) and (c). The contours in (c) are the VLA 5 GHz (C band) A-array radio data from Gallimore et al. (1996).
Current usage metrics show cumulative count of Article Views (full-text article views including HTML views, PDF and ePub downloads, according to the available data) and Abstracts Views on Vision4Press platform.
Data correspond to usage on the plateform after 2015. The current usage metrics is available 48-96 hours after online publication and is updated daily on week days.
Initial download of the metrics may take a while.