Fig. 4.
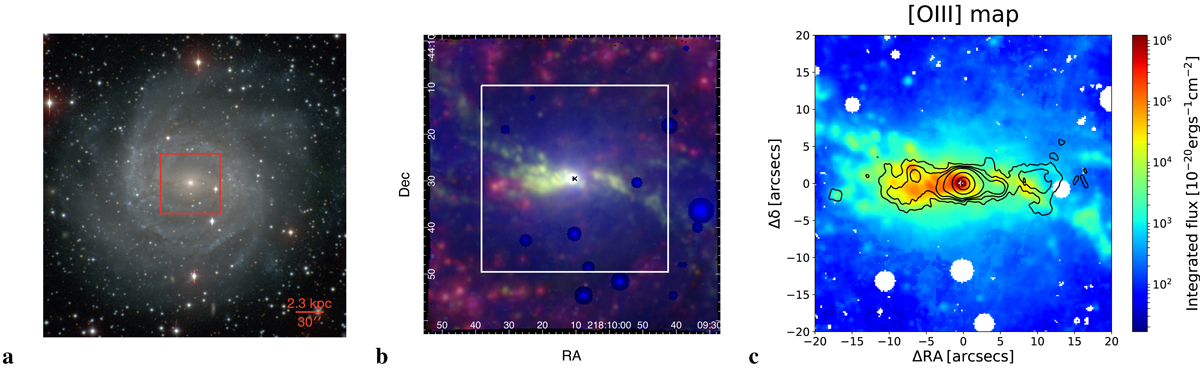
NGC 5643. (a) Three-colour image of NGC 5643 (B band in blue, V band in green, and I band in red) obtained with the 2.5 m du Pont Telescope at Las Campanas Observatory for the Carnegie-Irvine Galaxy Survey (CGS, Ho et al. 2011). The red box shows the FOV of our MUSE map in panel b, whose side spans ∼5 kpc. Same as in Fig. 1 for (b) and (c). The contours display the 8.4 GHz VLA radio observations from Leipski et al. (2006).
Current usage metrics show cumulative count of Article Views (full-text article views including HTML views, PDF and ePub downloads, according to the available data) and Abstracts Views on Vision4Press platform.
Data correspond to usage on the plateform after 2015. The current usage metrics is available 48-96 hours after online publication and is updated daily on week days.
Initial download of the metrics may take a while.