Fig. 3.
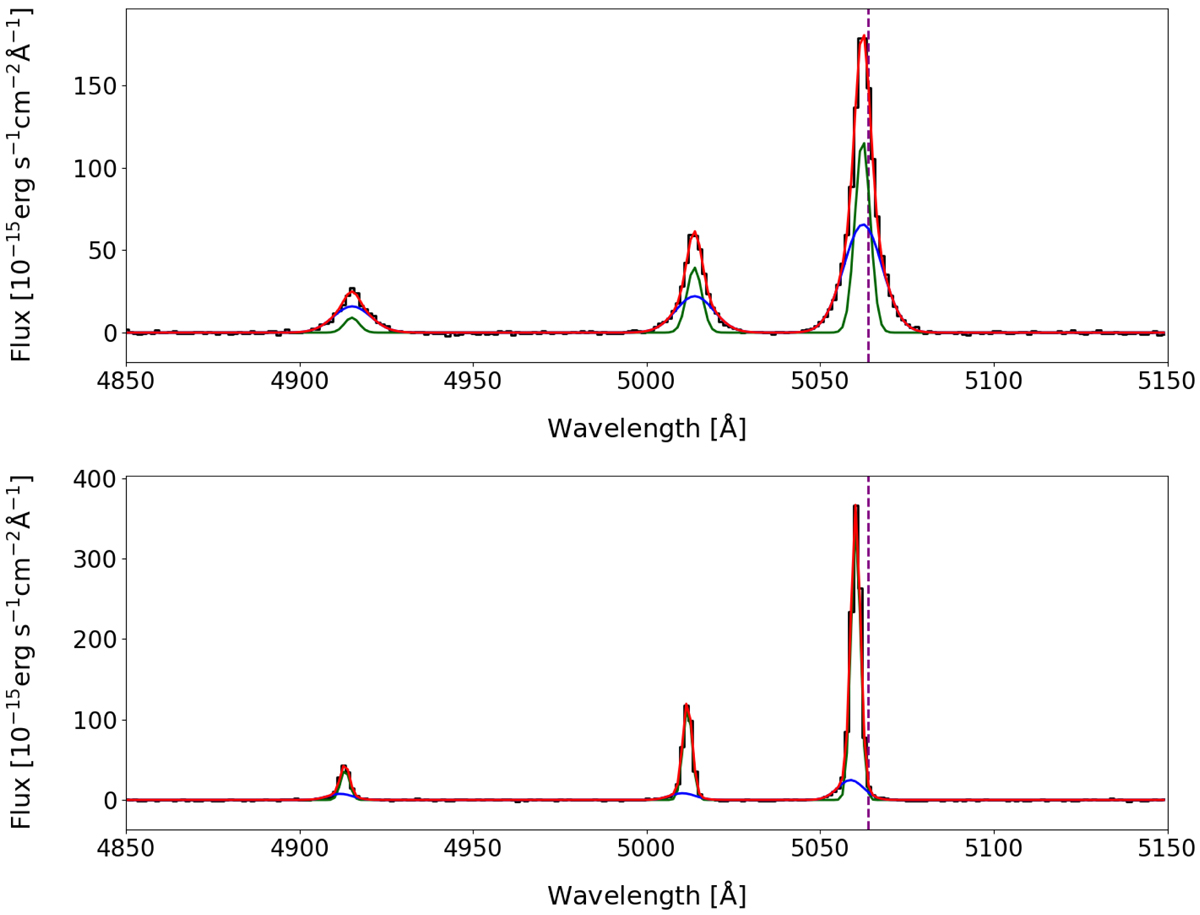
Spectra of IC 5063 in the [O III] doublet (right) and Hβ (left) spectral range extracted from the apertures shown in Fig. 2b. The spectrum in the top panel is representative of the region of line velocity width enhancement, exhibiting wide, fairly symmetric line profiles with no clear net velocity, while the spectrum in the bottom panel comes from the direction of the radio jet and ionisation cones and presents narrower profiles with asymmetric wings and a higher overall net velocity of the gas. The dashed purple lines indicate the galaxy systemic velocity. The wavelengths are reported in the observed frame.
Current usage metrics show cumulative count of Article Views (full-text article views including HTML views, PDF and ePub downloads, according to the available data) and Abstracts Views on Vision4Press platform.
Data correspond to usage on the plateform after 2015. The current usage metrics is available 48-96 hours after online publication and is updated daily on week days.
Initial download of the metrics may take a while.