Open Access
Fig. A.2.
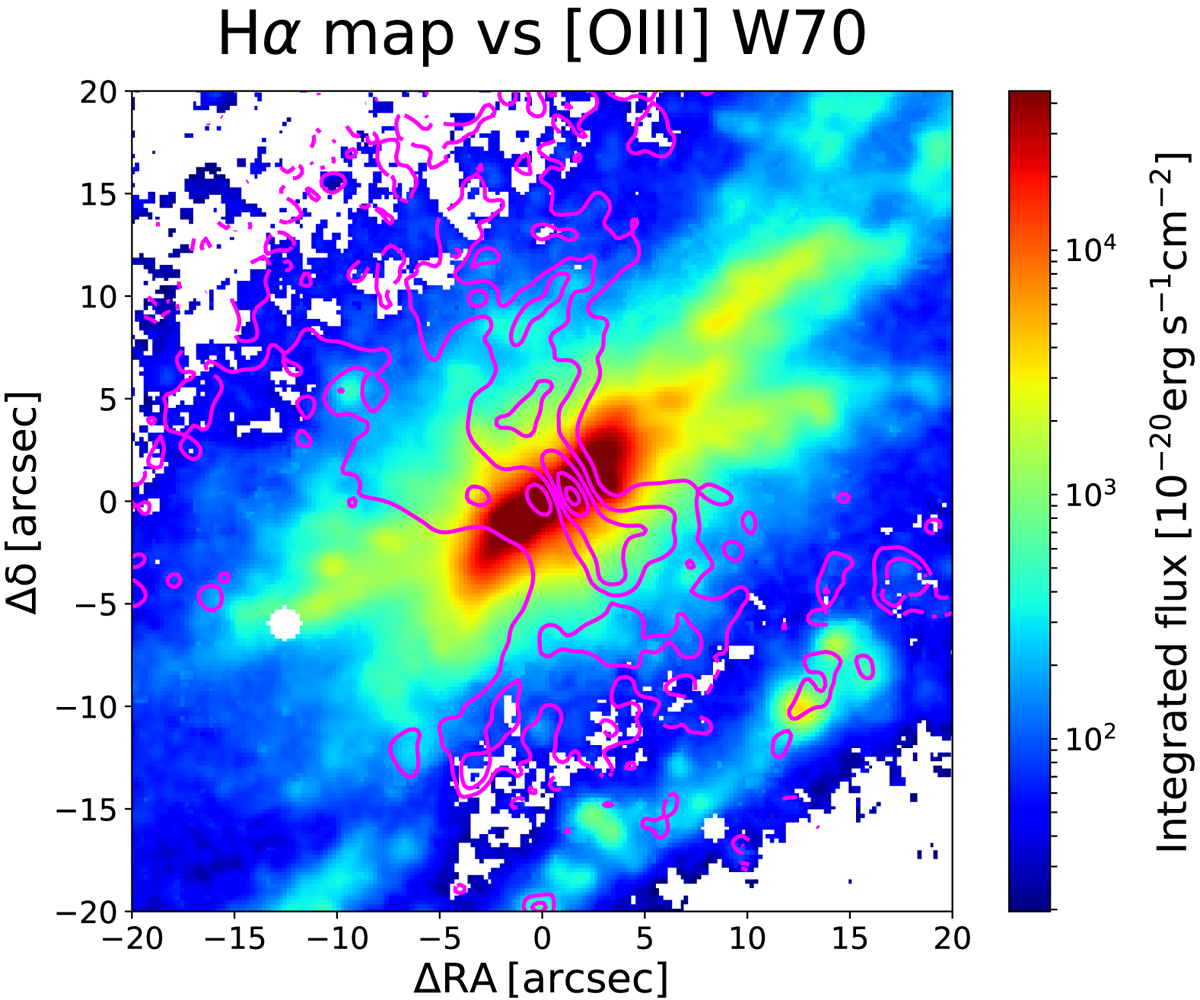
Map of Hα emission of IC 5063. The [O III] W70 contours are superimposed. The map shows that the stripe of Hα star-forming (as indicated by the BPT diagram in Figs. 2c,d) clumps to the SW of the nucleus are in the direction of the high-W70 material, approximately at its edge.
Current usage metrics show cumulative count of Article Views (full-text article views including HTML views, PDF and ePub downloads, according to the available data) and Abstracts Views on Vision4Press platform.
Data correspond to usage on the plateform after 2015. The current usage metrics is available 48-96 hours after online publication and is updated daily on week days.
Initial download of the metrics may take a while.