Fig. 1.
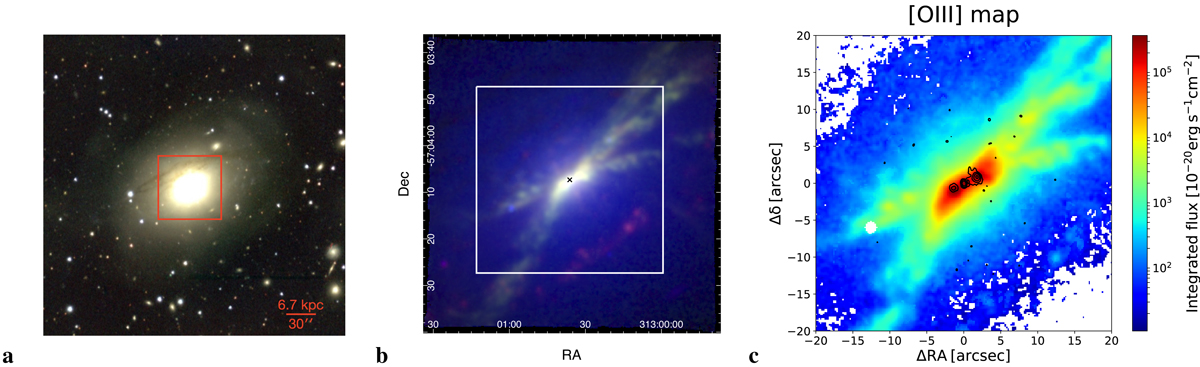
IC 5063. (a) Coloured image of IC 5063 in g, r, i filters from Dark Energy Survey (DES) DR1 LIneA (Abbott et al. 2018). The red box shows the FOV of our MUSE map in panel b, whose side spans ∼14 kpc. (b) Three-colour image from MUSE, showing [O III] (green), Hα (red), and stellar continuum (blue) collapsed in the spectral range ∼5100–5800 Å. [O III] and Hα fluxes are obtained from modelling the stellar continuum-subtracted, 1 spaxel-σ smoothed data cube. [O III] is also separately reported in (c) in a 40″ × 40″ zoomed region (white box). The reported flux is per pixel. An S/N cut of 3 has been applied. Circular masked regions mark spaxels that were excluded because Galactic foreground stars disturbed the data analysis. The ATCA 17.8 GHz radio contours from Morganti et al. (2007) are superimposed. North is up and west is right.
Current usage metrics show cumulative count of Article Views (full-text article views including HTML views, PDF and ePub downloads, according to the available data) and Abstracts Views on Vision4Press platform.
Data correspond to usage on the plateform after 2015. The current usage metrics is available 48-96 hours after online publication and is updated daily on week days.
Initial download of the metrics may take a while.