Fig. A.22
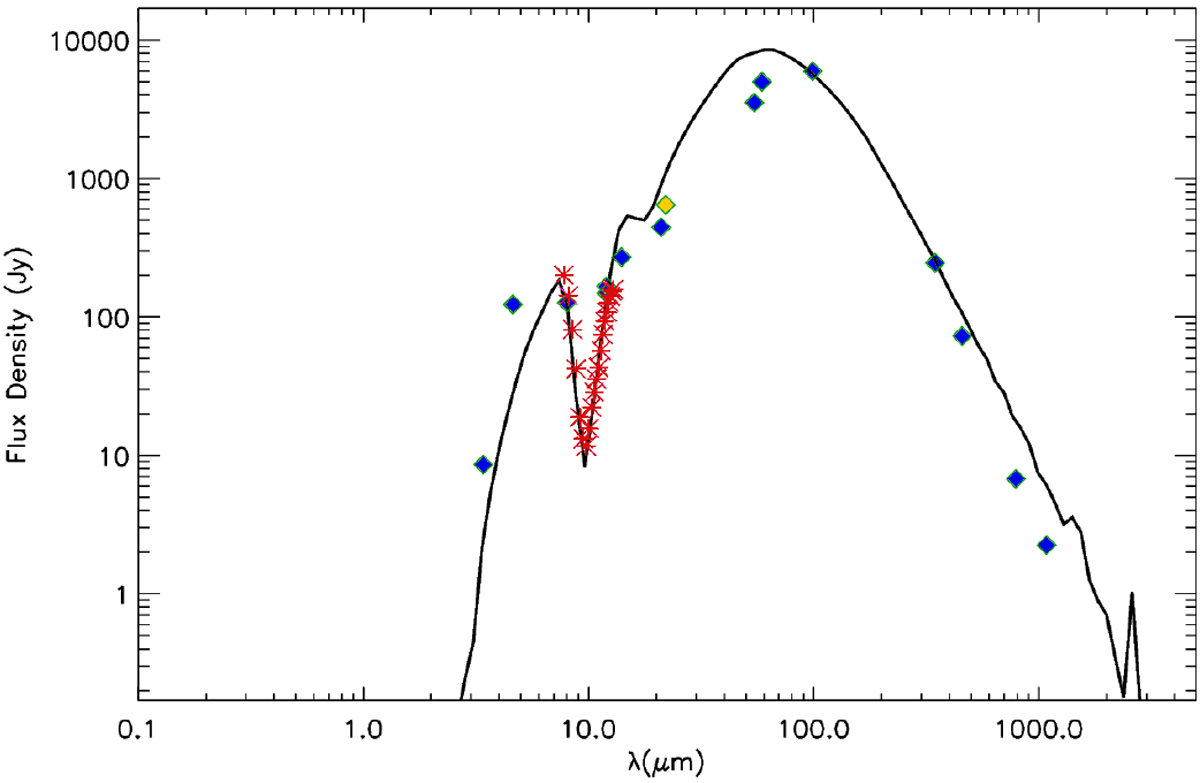
Model SED of the best-fitting model (black). Multi-wavelength flux measurements from the RMS are represented as blue diamonds, the yellow diamond represents the COMICS flux density and the fluxes corresponding to the MIDI visibilities are also shown in red. The unfilled diamonds represent the fluxes that were not considered in the fitting due to their suspected contamination.
Current usage metrics show cumulative count of Article Views (full-text article views including HTML views, PDF and ePub downloads, according to the available data) and Abstracts Views on Vision4Press platform.
Data correspond to usage on the plateform after 2015. The current usage metrics is available 48-96 hours after online publication and is updated daily on week days.
Initial download of the metrics may take a while.