Fig. A.9
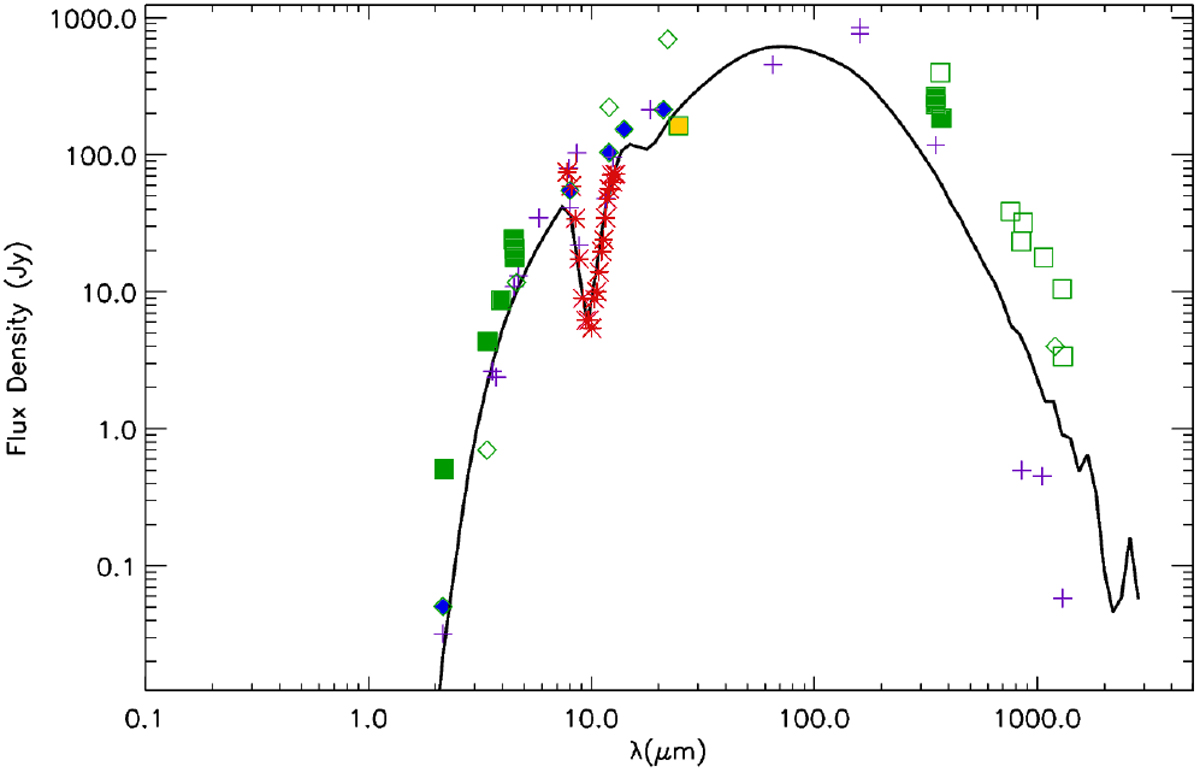
Model SED of the best-fitting model (black) for S255 IRS3. The different symbols correspond to different datasets, purple crosses are data from Caratti o Garatti et al. (2017), blue diamonds are fluxes from the RMS database, squares are data from de Wit et al. (2009) (with the COMICS flux in yellow) and the fluxes corresponding to the MIDI visibilities are also shown in red. Open symbols correspond to upper limits.
Current usage metrics show cumulative count of Article Views (full-text article views including HTML views, PDF and ePub downloads, according to the available data) and Abstracts Views on Vision4Press platform.
Data correspond to usage on the plateform after 2015. The current usage metrics is available 48-96 hours after online publication and is updated daily on week days.
Initial download of the metrics may take a while.