Fig. B.1
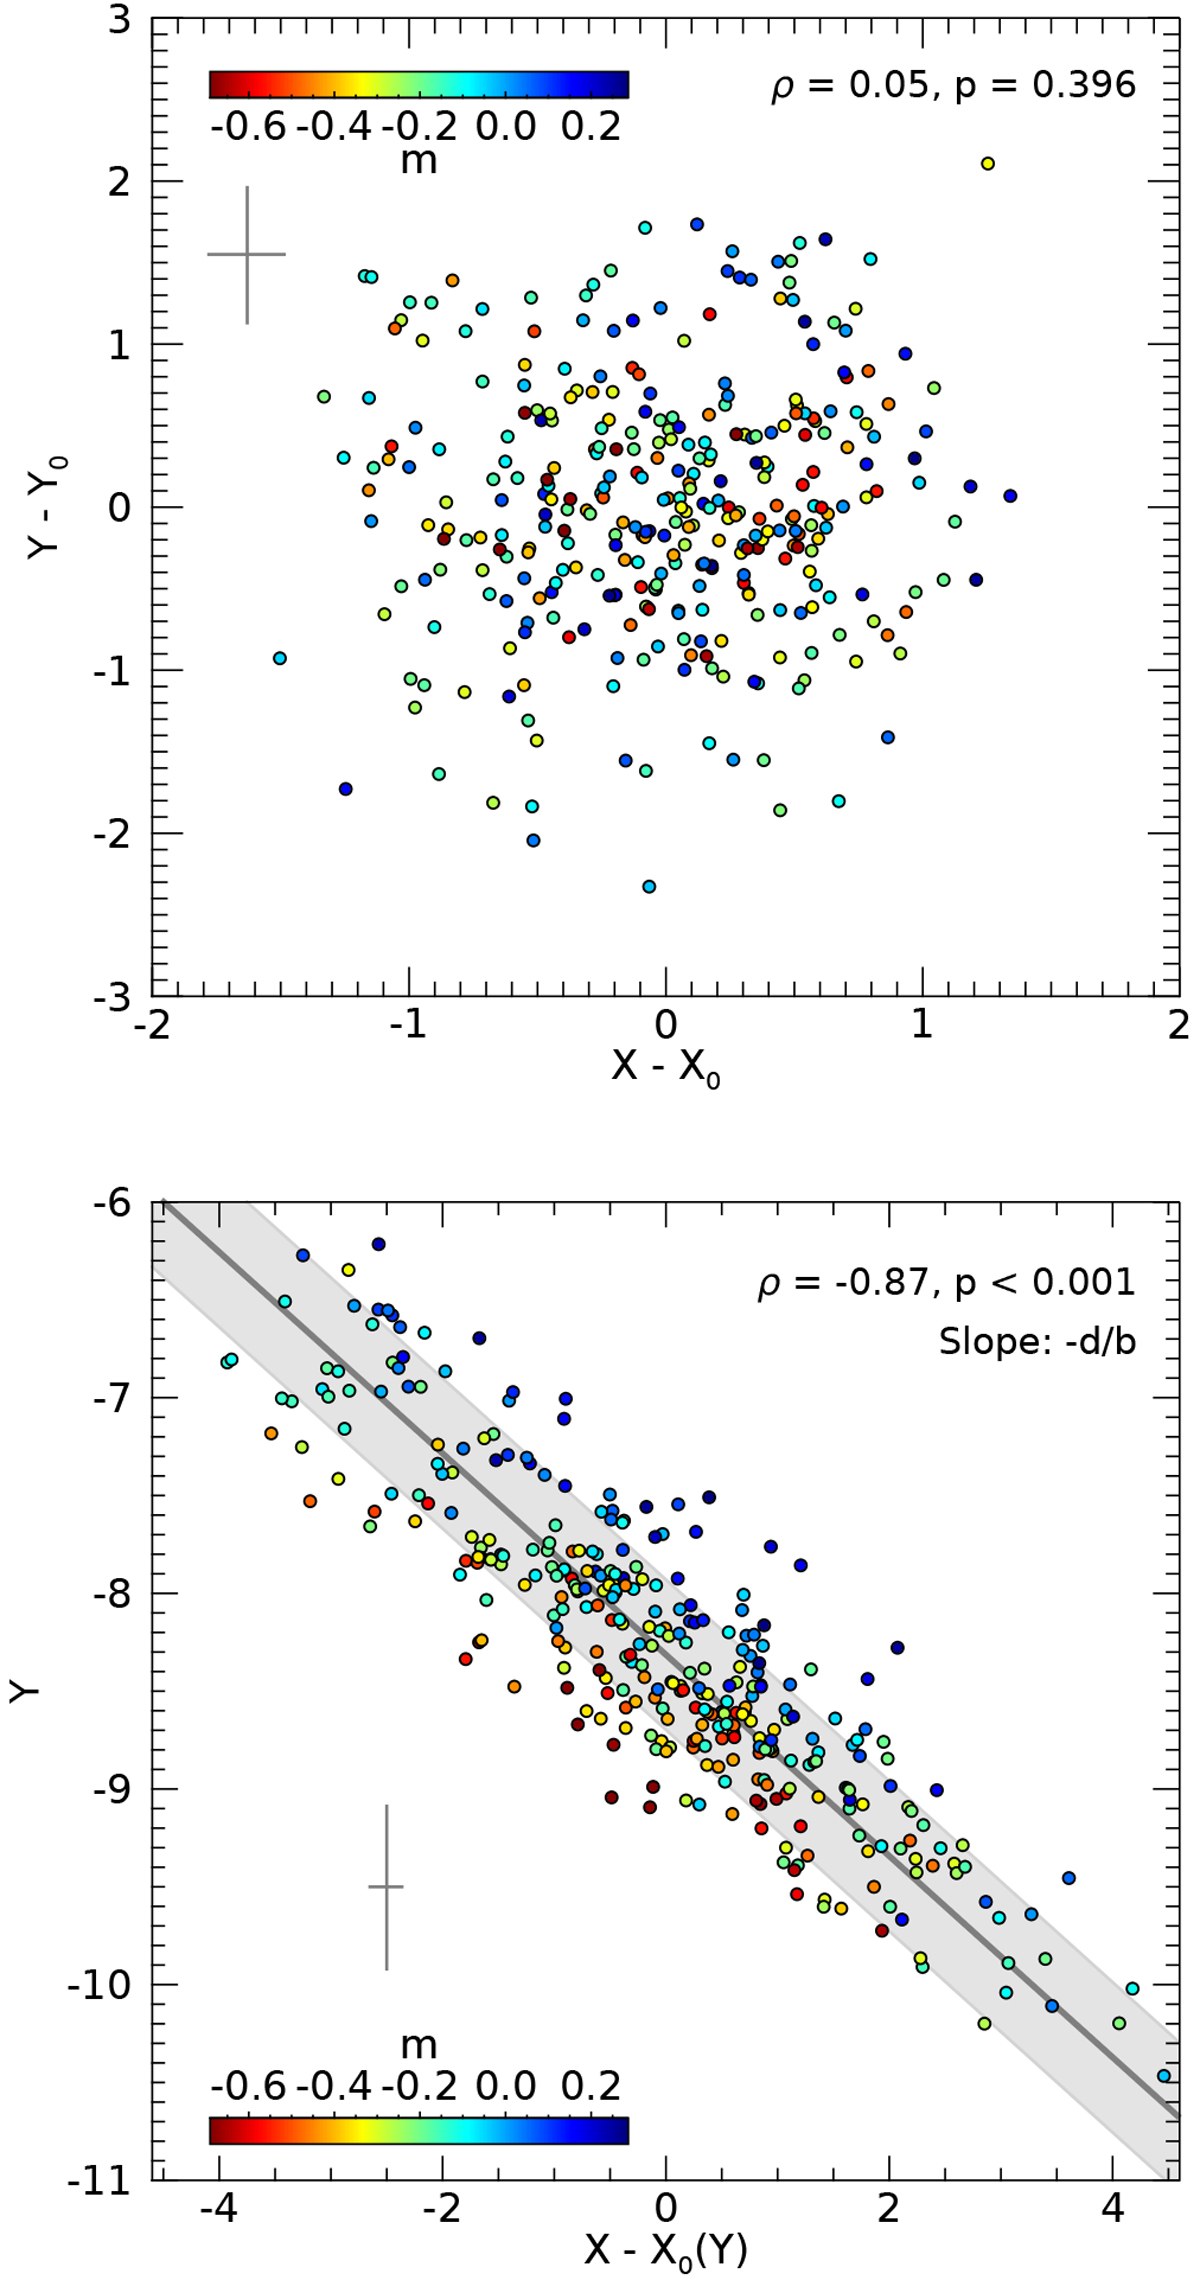
Correlations of the simulated data. Top: result of the partial regression analysis on a synthetic data set with 332 sources together with normally distributed scatter, which was chosen to be similar to the measured values. There is no correlation, as expected. Bottom: method used by Telleschi et al. (2007) and Bustamante et al. (2016) applied to the same data set. The values scatter around a line with a slope of − d∕b and not around a constant, as assumed by Telleschi et al. (2007). The reason is a common response variable, sy, introduced as an artifact of the analysis method as described in Sect. 3.2.
Current usage metrics show cumulative count of Article Views (full-text article views including HTML views, PDF and ePub downloads, according to the available data) and Abstracts Views on Vision4Press platform.
Data correspond to usage on the plateform after 2015. The current usage metrics is available 48-96 hours after online publication and is updated daily on week days.
Initial download of the metrics may take a while.