Free Access
Fig. A.1
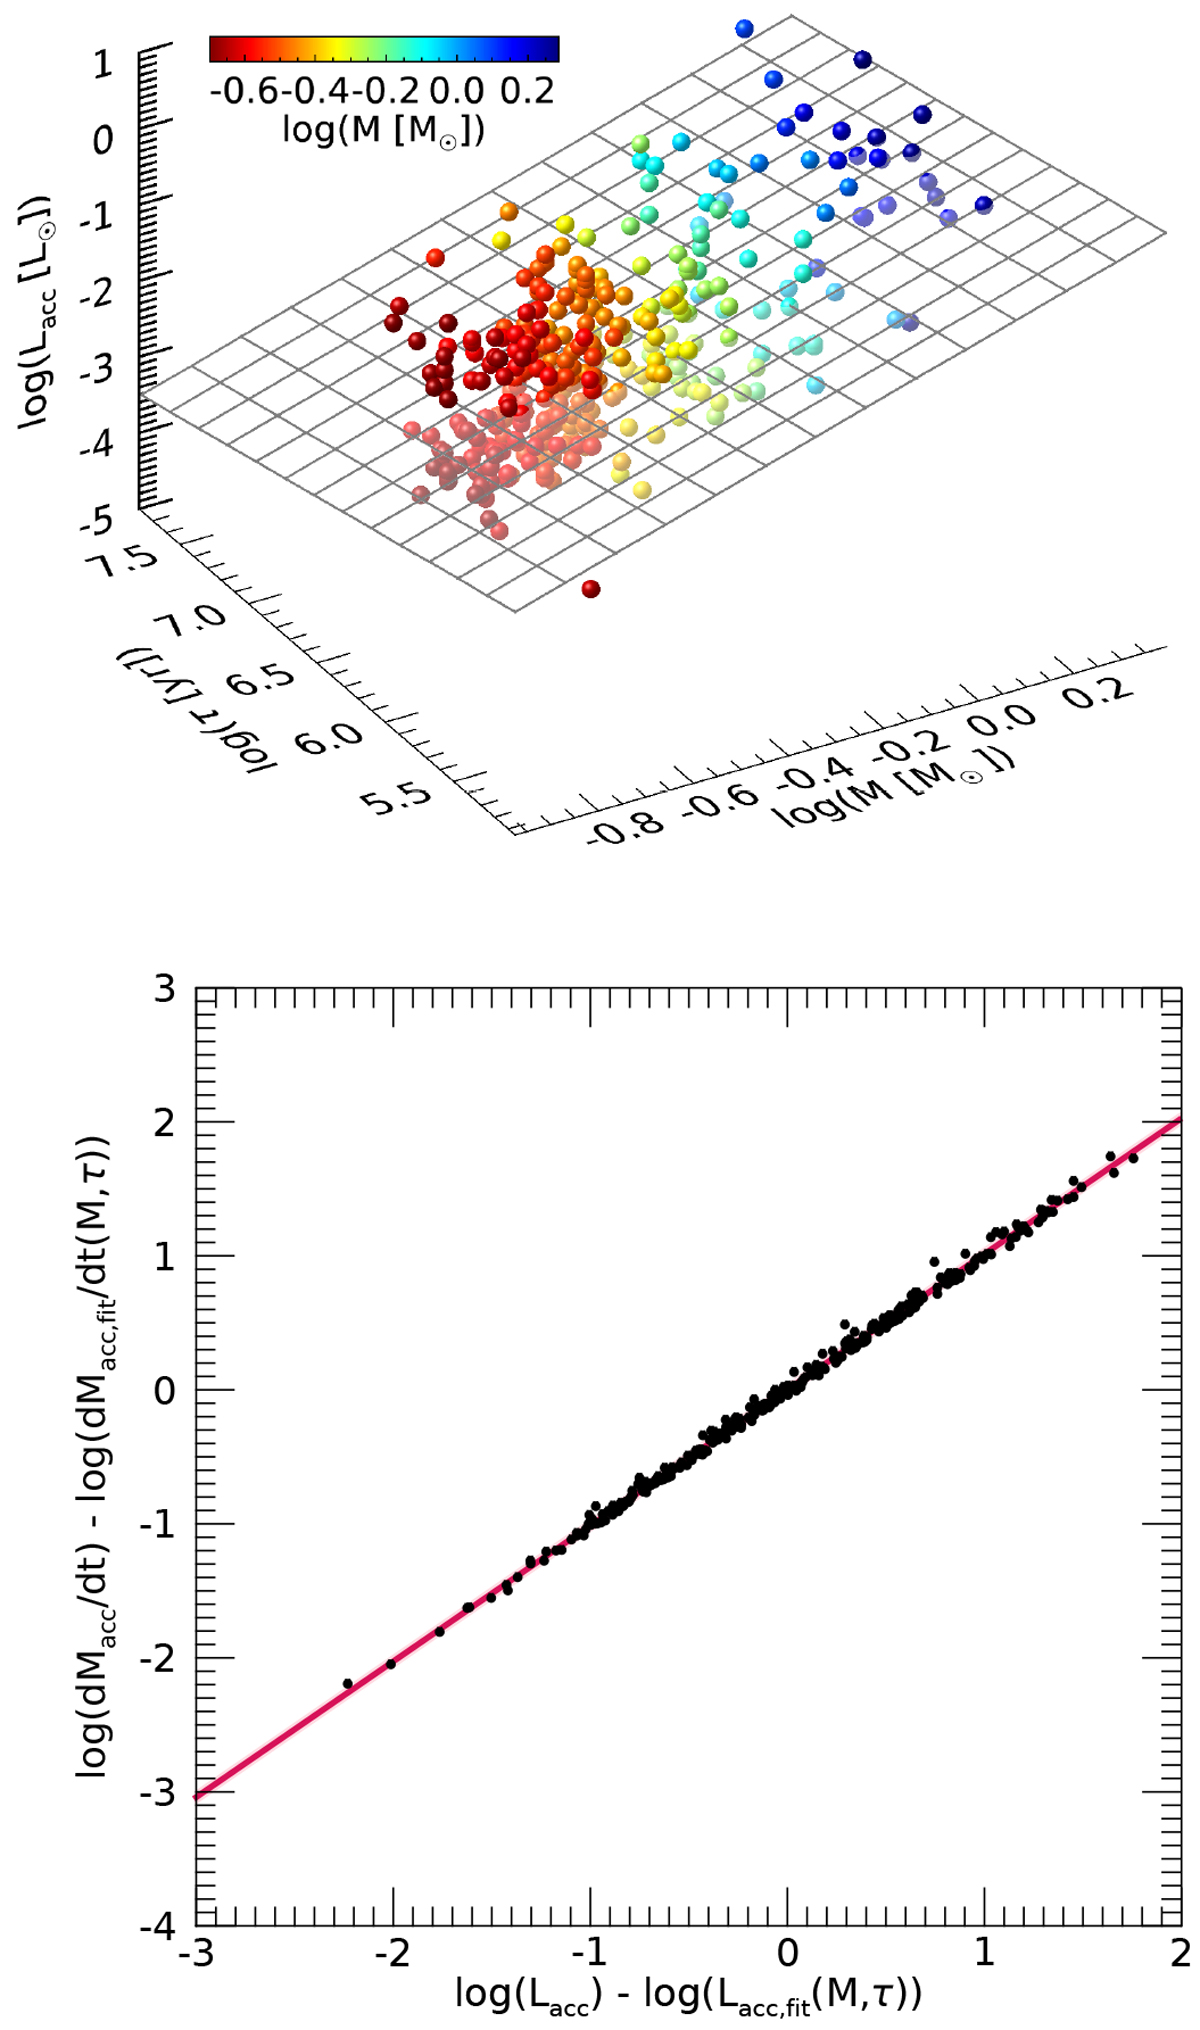
Correlations of the accretion luminosity Lacc. Top: 3D plotof Lacc with respect to both M and τ. The plot points are color coded according to the masses. Bottom: residual mass accretion rate as a function of the residual accretion luminosity.
Current usage metrics show cumulative count of Article Views (full-text article views including HTML views, PDF and ePub downloads, according to the available data) and Abstracts Views on Vision4Press platform.
Data correspond to usage on the plateform after 2015. The current usage metrics is available 48-96 hours after online publication and is updated daily on week days.
Initial download of the metrics may take a while.