Free Access
Fig. 5
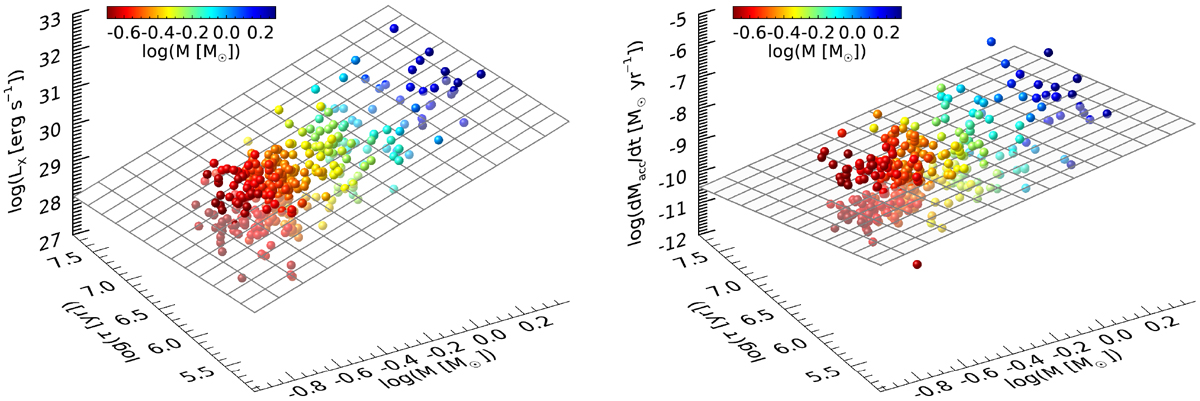
3D plots of LX (left) and Ṁacc (right) with respect to both M and τ. The plots also show the best-fit surface described by the equation logY = A + B × logM + C × logτ, where Y stands for both LX and Ṁacc. The coefficients of the fits are listed in Table 1. The plot points are color coded according to the masses.
Current usage metrics show cumulative count of Article Views (full-text article views including HTML views, PDF and ePub downloads, according to the available data) and Abstracts Views on Vision4Press platform.
Data correspond to usage on the plateform after 2015. The current usage metrics is available 48-96 hours after online publication and is updated daily on week days.
Initial download of the metrics may take a while.