Fig. 3
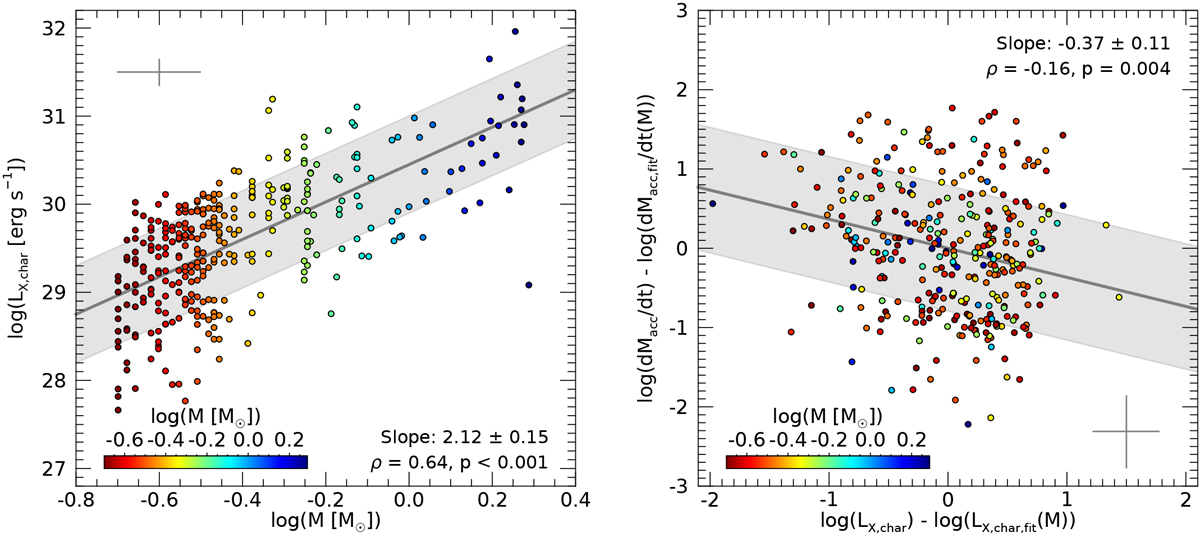
Correlations using the “characteristic” X-ray luminosity LX, char. Left: LX, char vs. M. The cross indicates the typical uncertainties. The LX, char−M relation doesnot differ significantly from the LX−M relation (see Fig. 1). Right: same plot as in Fig. 2, but corrected for flaring activity, as described in Sect. 3.4. The anticorrelation is stronger and more significant.
Current usage metrics show cumulative count of Article Views (full-text article views including HTML views, PDF and ePub downloads, according to the available data) and Abstracts Views on Vision4Press platform.
Data correspond to usage on the plateform after 2015. The current usage metrics is available 48-96 hours after online publication and is updated daily on week days.
Initial download of the metrics may take a while.