Fig. 2
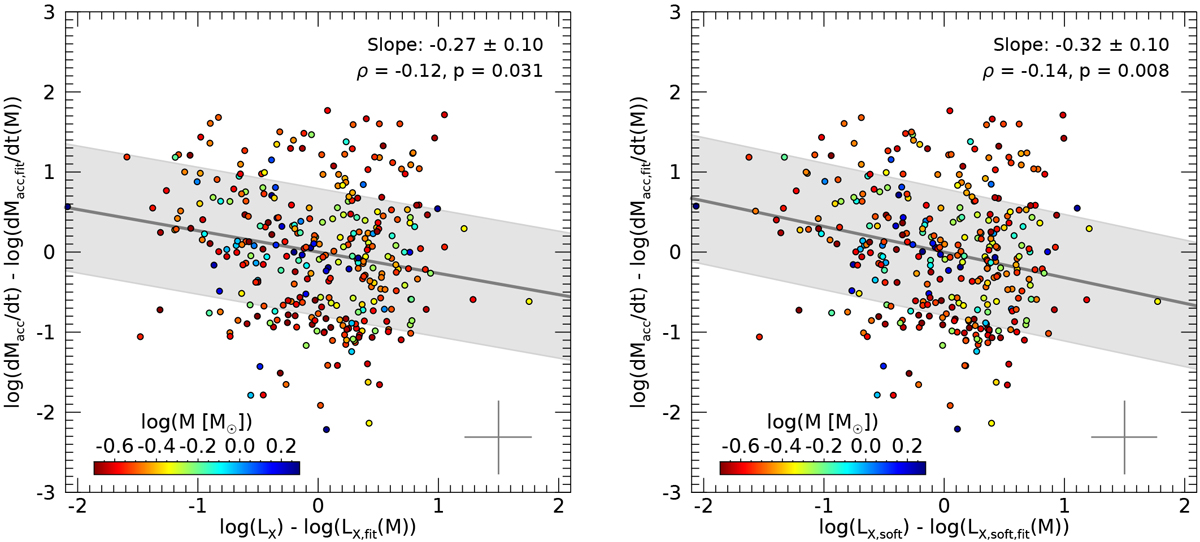
Correlation of the residual mass accretion rate and the residual X-ray luminosity. Left: residual mass accretion rate as a function of residual X-ray luminosity. The regression line was obtained with the Bayesian LINMIX_ERR method, and the shaded region shows its 1σ scatter. The cross indicates the typical uncertainties. There is a weak anticorrelation. Right: residual mass accretion rate as a function of the residual soft band (0.5–2.0 keV) X-ray luminosity. The anticorrelation is stronger and more significant.
Current usage metrics show cumulative count of Article Views (full-text article views including HTML views, PDF and ePub downloads, according to the available data) and Abstracts Views on Vision4Press platform.
Data correspond to usage on the plateform after 2015. The current usage metrics is available 48-96 hours after online publication and is updated daily on week days.
Initial download of the metrics may take a while.