Fig. 6.
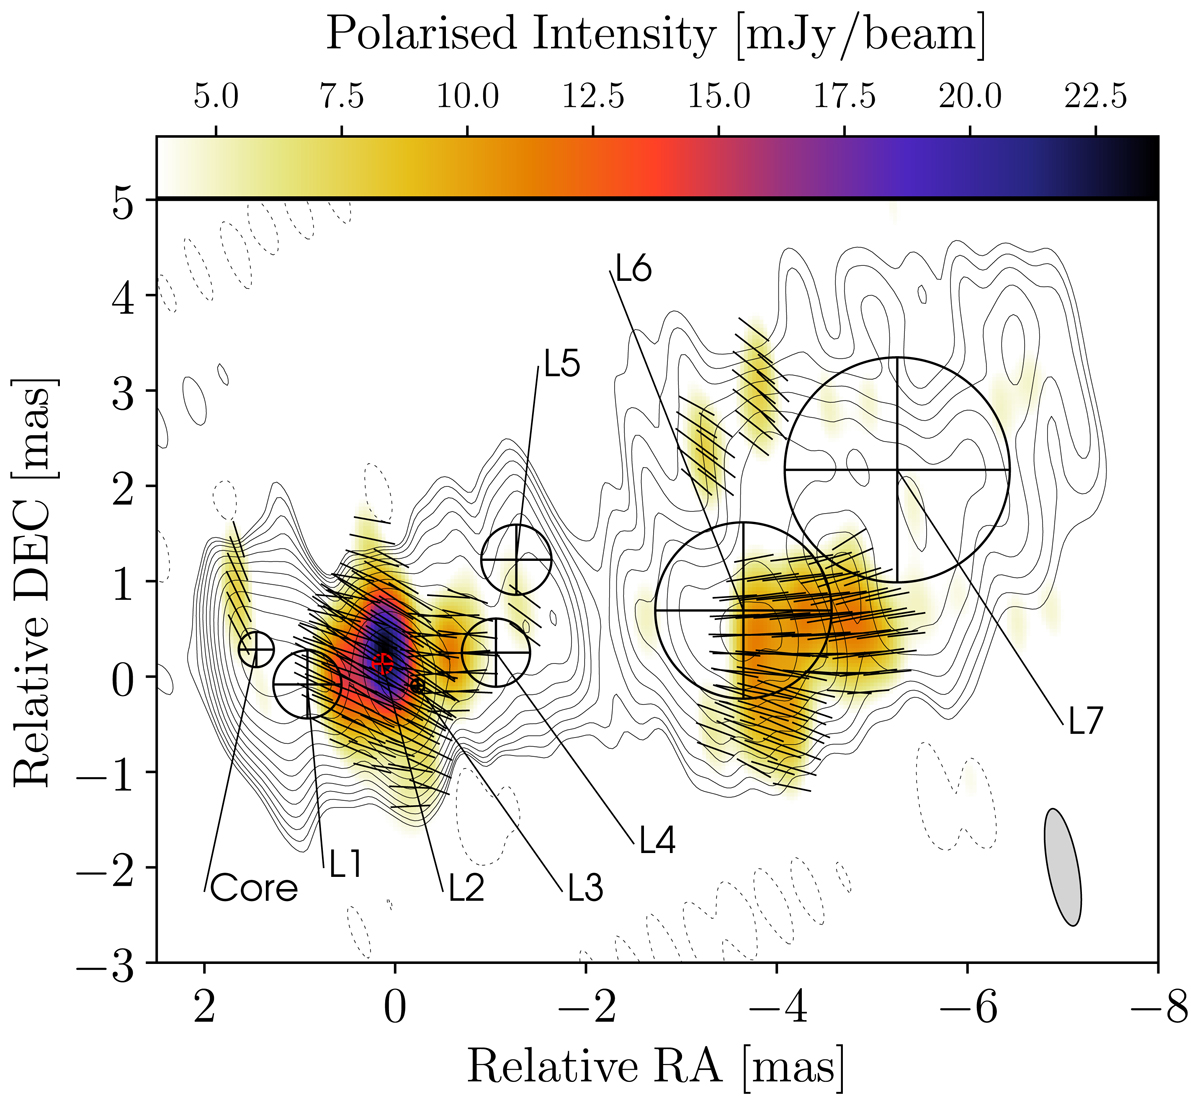
RadioAstron image of the total intensity and polarised emission of 3C 345 at 1.6 GHz. Map of the polarised intensity P in colour-scale, overlaid with contours displaying the total intensity emission. The beam size is displayed on the bottom right with a resolution of 1.25 × 0.32 mas. The lines show the EVPAs the length of which is proportional to P. Contours levels are (% of peak emission of 0.39 Jy beam−1): −2, 2, 2.83, 4, 5.65, 8, 11.31, 16, 22.63, 32, 45.25, 64, 90.51.
Current usage metrics show cumulative count of Article Views (full-text article views including HTML views, PDF and ePub downloads, according to the available data) and Abstracts Views on Vision4Press platform.
Data correspond to usage on the plateform after 2015. The current usage metrics is available 48-96 hours after online publication and is updated daily on week days.
Initial download of the metrics may take a while.