Fig. 9.
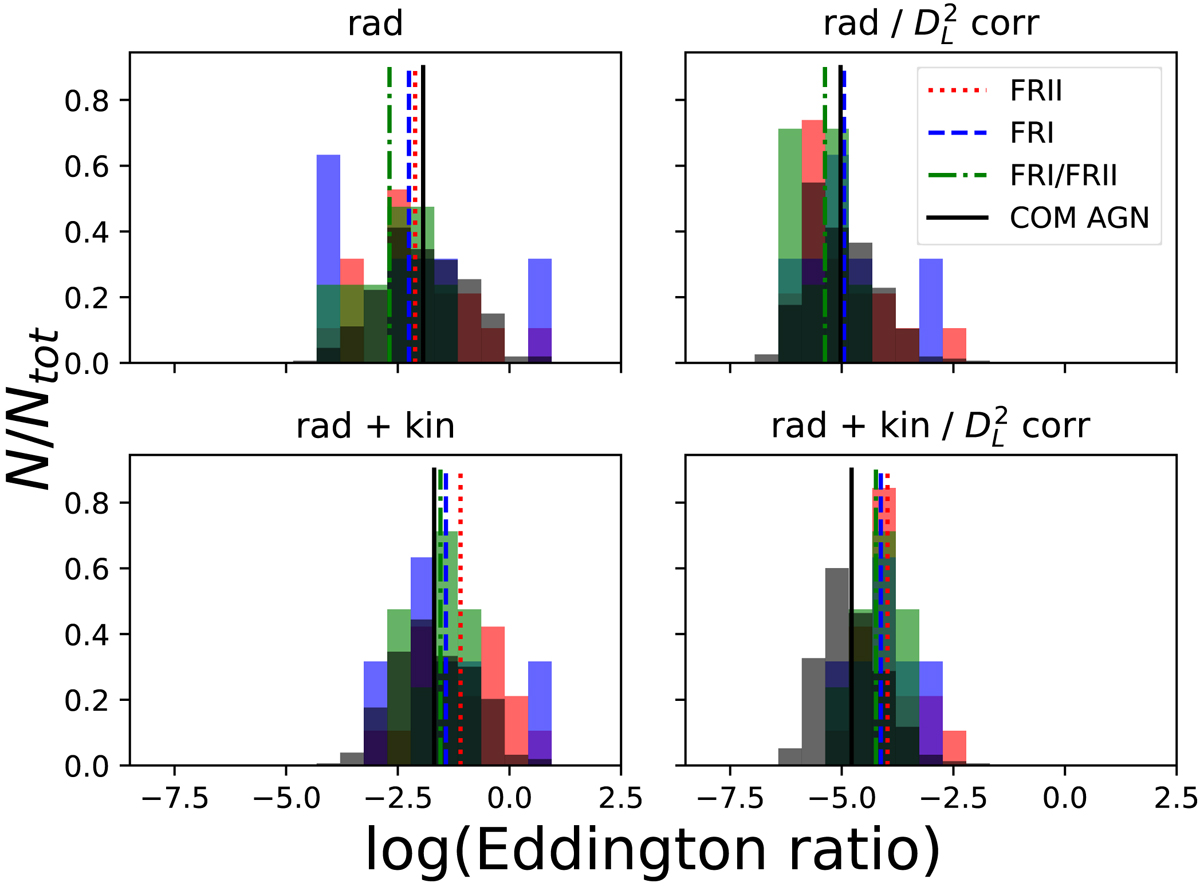
Histogram of Eddington ratios of X-ray detected sources, colour-coded based on our classification scheme in FRII (red), FRI (blue), FRI/FRII (green) and COM AGN (black). Top panels: radiative Eddington ratio (left) and the redshift-dependence corrected Eddington ratio (right). Bottom panels: radiative and kinetic Eddington ratio (left) and the redshift-dependence corrected Eddington ratio (right). The median values of the Eddington ratio for each population are shown as lines: dotted red lines show FRIIs, dashed blue show FRIs, dashed-dotted green show FRI/FRIIs, and solid black lines show COM AGN.
Current usage metrics show cumulative count of Article Views (full-text article views including HTML views, PDF and ePub downloads, according to the available data) and Abstracts Views on Vision4Press platform.
Data correspond to usage on the plateform after 2015. The current usage metrics is available 48-96 hours after online publication and is updated daily on week days.
Initial download of the metrics may take a while.