Fig. 3.
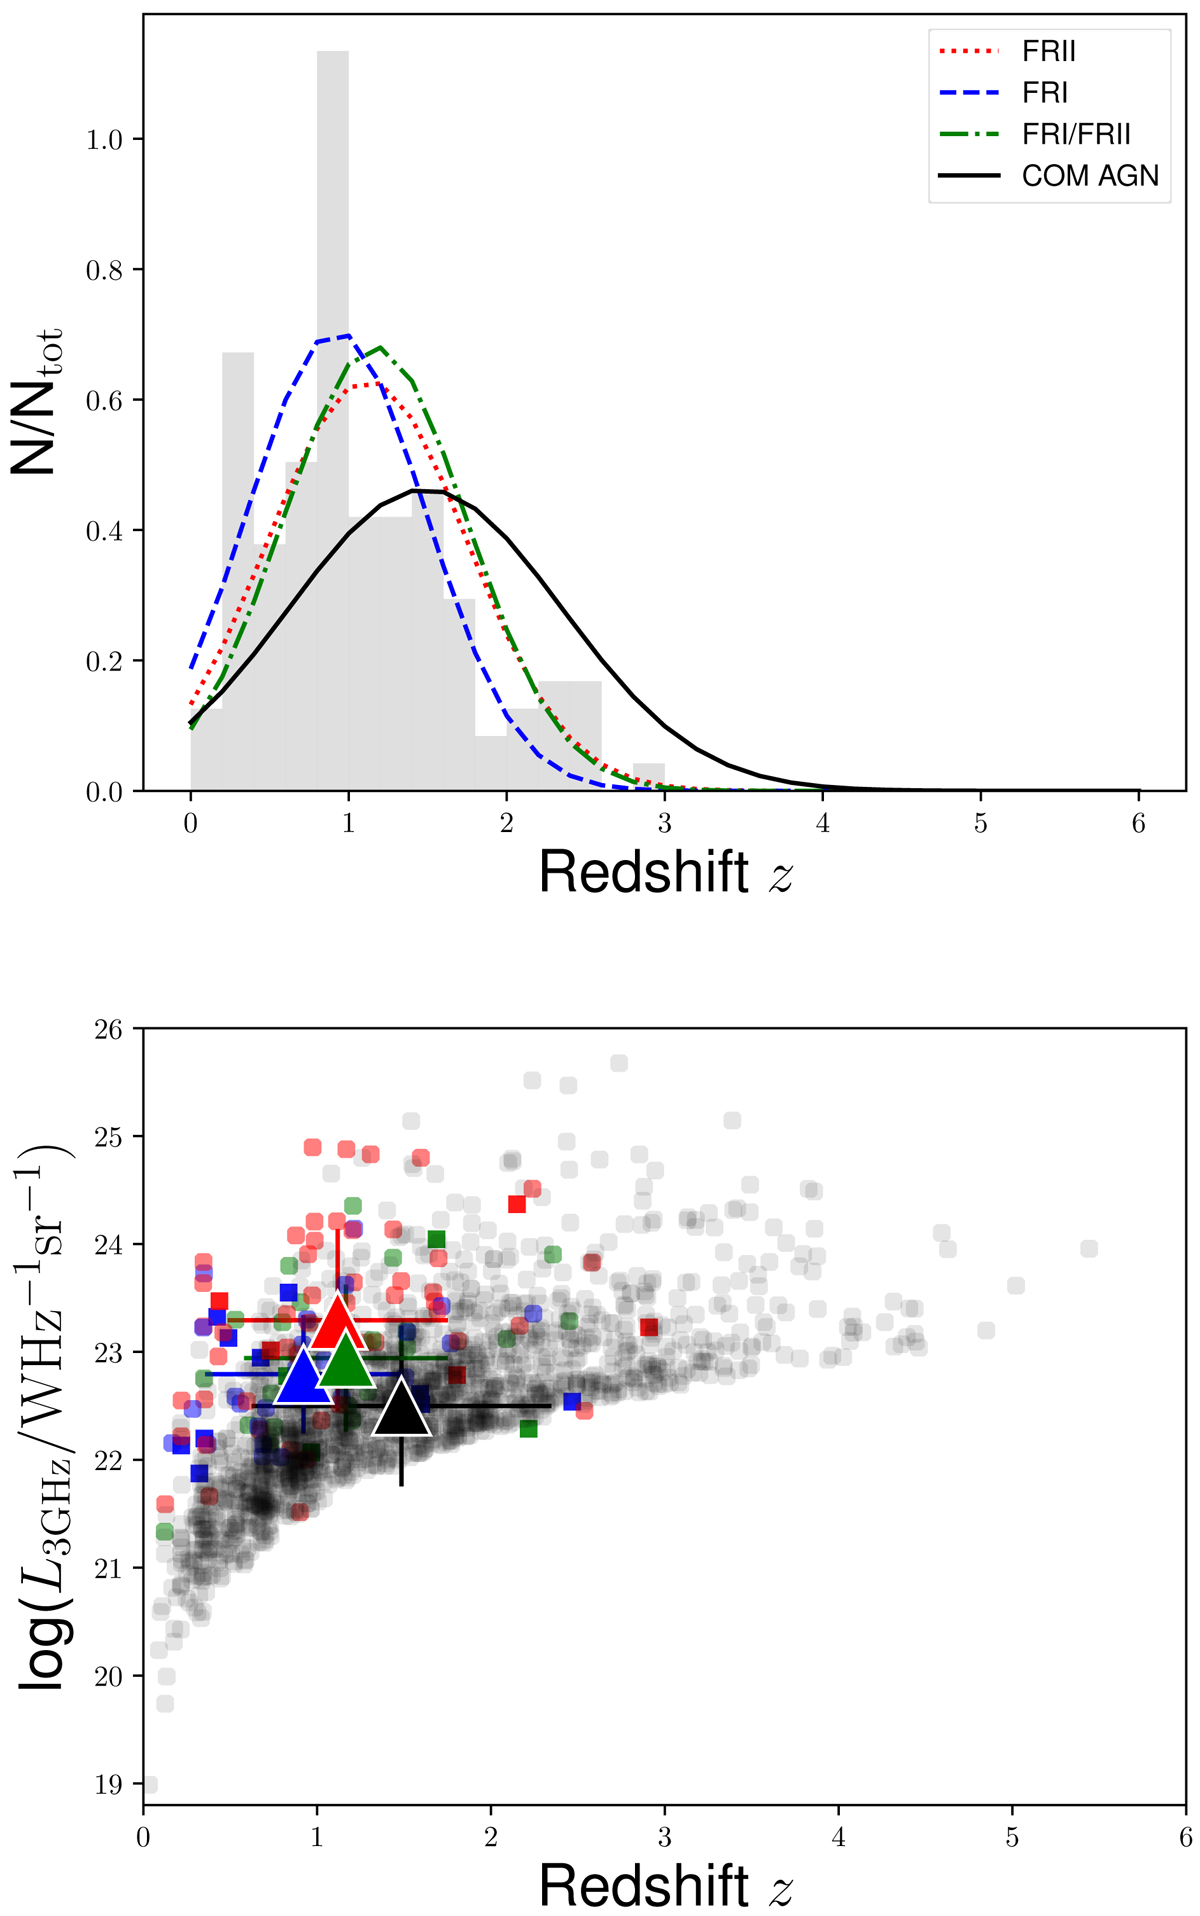
Top: redshift distribution of the FR-type sources in our sample shown in grey. The Gaussian distributions show Gaussian fits to the redshift distribution of different populations, colour-coded based on radio classification: FRIIs (red), FRIs (blue), and FRI/FRII (green). We also show the COM AGN control sample as a black solid line. Bottom: radio luminosity at 3 GHz vs. redshift for the FRIIs (red), FRIs (blue), FRI/FRII (green), and COM AGN (black) in our sample. The large triangles give the corresponding mean values for each population and the standard deviation. Squares are objects without radio excess.
Current usage metrics show cumulative count of Article Views (full-text article views including HTML views, PDF and ePub downloads, according to the available data) and Abstracts Views on Vision4Press platform.
Data correspond to usage on the plateform after 2015. The current usage metrics is available 48-96 hours after online publication and is updated daily on week days.
Initial download of the metrics may take a while.