Free Access
Fig. A.1.
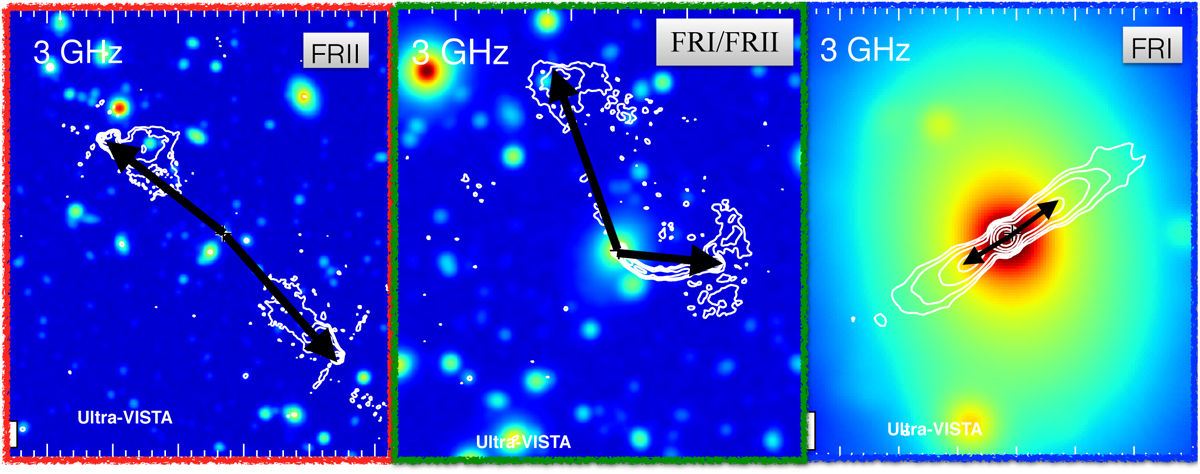
Examples of FRII (left), FRI/FRII (middle), and FRI (right) radio sources. The arrows mark the point of high intensity along the radio structure. Contours are the 3 GHz data and the colour scale background is the Ultra-VISTA mosaic (see Fig. 2).
Current usage metrics show cumulative count of Article Views (full-text article views including HTML views, PDF and ePub downloads, according to the available data) and Abstracts Views on Vision4Press platform.
Data correspond to usage on the plateform after 2015. The current usage metrics is available 48-96 hours after online publication and is updated daily on week days.
Initial download of the metrics may take a while.