Fig. 20.
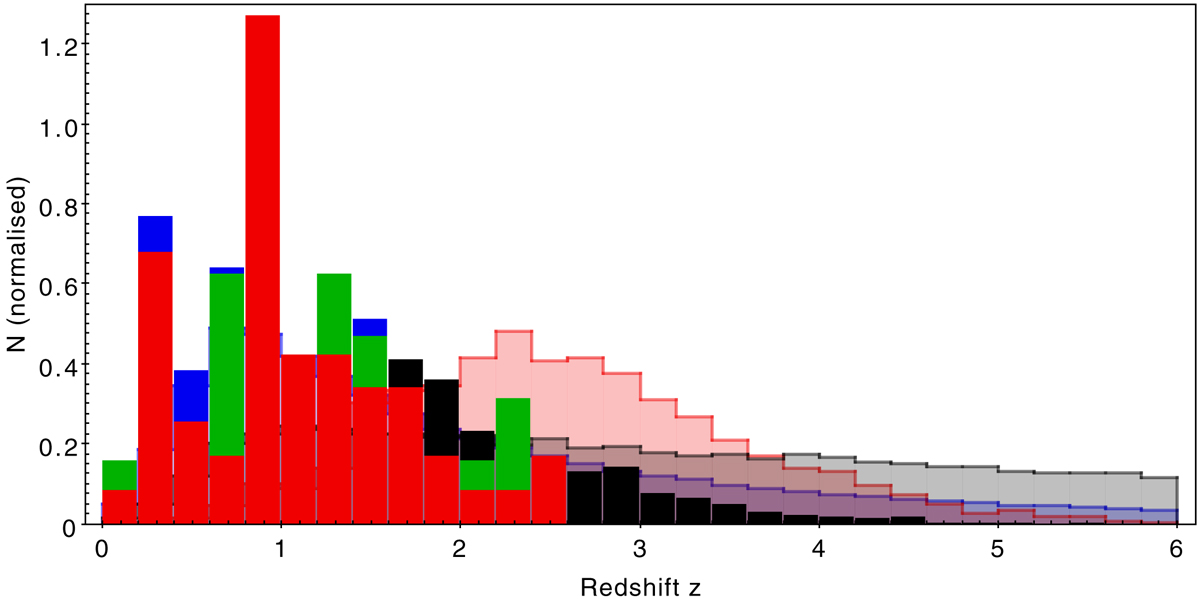
Histogram of the redshift distribution between the radio AGN in the 3 GHz VLA-COSMOS sample and the S3-SEX semi-empirical simulation (Wilman et al. 2008) for a sky area of 20 × 20 deg2 centred at the central coordinates of the simulation, and for a flux density limit of 17 μJy. The total area of the histogram bars is normalised to unity. Solid histograms correspond to 3 GHz data and semi-filled to the simulation. The bin size is 0.2. Red shows FRII, green shows FRI/FRII, blue shows FRI, and black shows COM AGN or GPS.
Current usage metrics show cumulative count of Article Views (full-text article views including HTML views, PDF and ePub downloads, according to the available data) and Abstracts Views on Vision4Press platform.
Data correspond to usage on the plateform after 2015. The current usage metrics is available 48-96 hours after online publication and is updated daily on week days.
Initial download of the metrics may take a while.