Fig. 2.
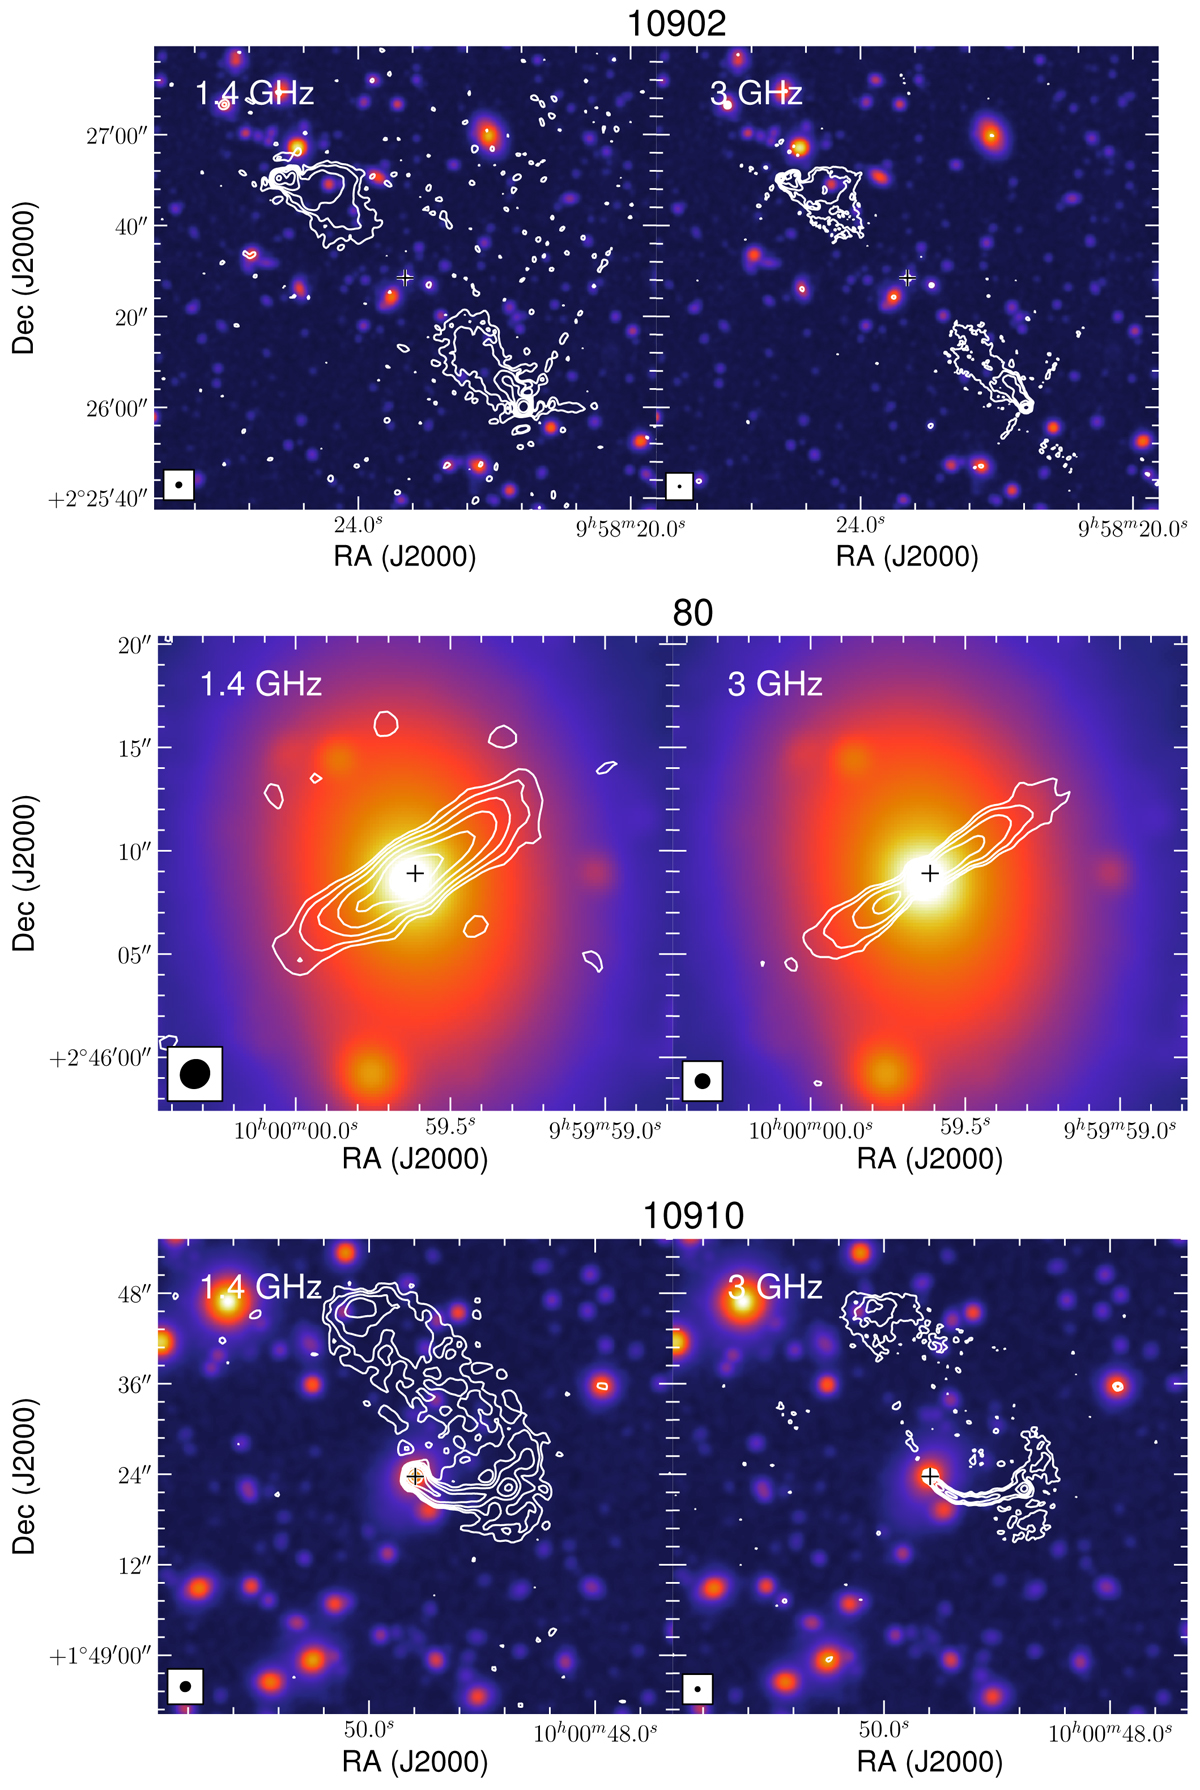
Set of 1.4 GHz VLA (left) and 3 GHz VLA (right) stamps for examples of FRII (top), FRI (middle), and FRI/FRII (bottom) objects, shown as white contours. These are overlaid on the Ultra-VISTA near-IR stacked image shown as a colour scale in arbitrary units. The beam size for the radio observations is shown at the bottom-left corner of the stamp: 1.4 × 1.5 arcsec2 for the 1.4 GHz and 0.75 arcsec FWHM for the 3 GHz maps. The contour levels are equally spaced on a log scale, with the lowest set at 3σ and the highest at the maximum peak flux-density of the radio structure. The remainder of the FR objects can be found in Fig. C.5.
Current usage metrics show cumulative count of Article Views (full-text article views including HTML views, PDF and ePub downloads, according to the available data) and Abstracts Views on Vision4Press platform.
Data correspond to usage on the plateform after 2015. The current usage metrics is available 48-96 hours after online publication and is updated daily on week days.
Initial download of the metrics may take a while.