Free Access
Fig. 19.
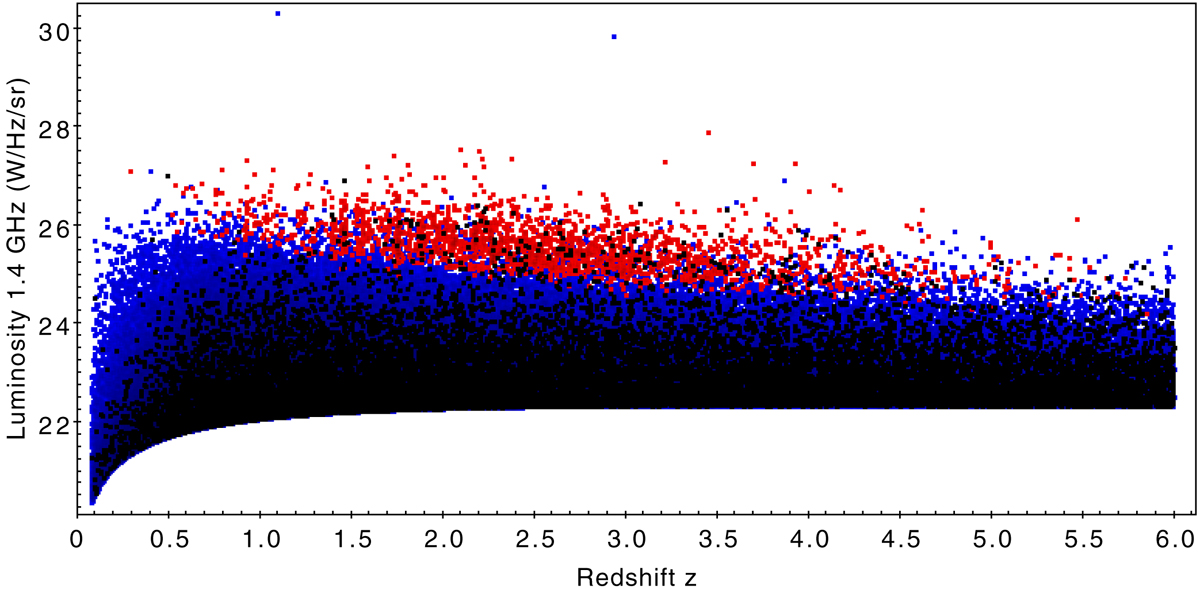
Radio luminosity at 1.4 GHz vs. redshift from the S3-SEX semi-empirical simulation (Wilman et al. 2008) for a sky area of 20 × 20 deg2 centred at the central coordinates of the simulation, and for a flux density limit of 17 μJy. Blue crosses are FRIs and red crosses are FRIIs, and GPS sources are plotted in black.
Current usage metrics show cumulative count of Article Views (full-text article views including HTML views, PDF and ePub downloads, according to the available data) and Abstracts Views on Vision4Press platform.
Data correspond to usage on the plateform after 2015. The current usage metrics is available 48-96 hours after online publication and is updated daily on week days.
Initial download of the metrics may take a while.